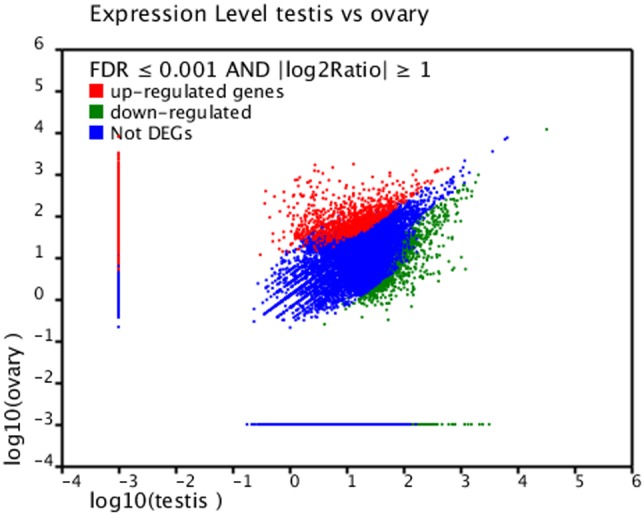
Figure 4. Scatter plots showing gene expression profiles in testis and ovary libraries of P. clarkii.

Limits defined by FDR ≤0.001 and |log2 ratio| ≥1. Blue dots represent genes with similar expression in testis and ovary; red and green dots indicate up-regulated and down-regulated genes in ovary, respectively (>1.5-fold change, black diagonals).
