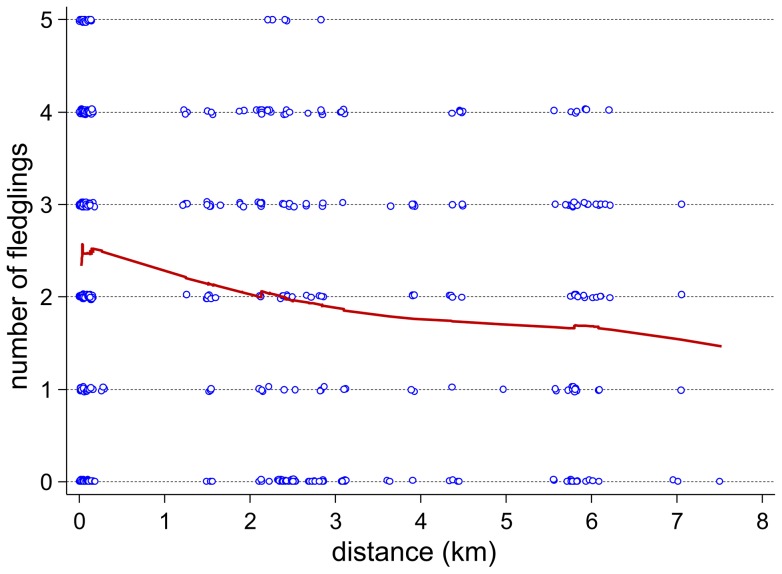
Figure 3. Number of fledglings per nest and year in relation to distance between the feeding place and nest site (km).
A Lowess (locally weighted scatterplot smoothing) curve is used to describe the trend of the data. Data points are slightly jittered (adding random noise to data) in order to prevent overplotting of data points.

