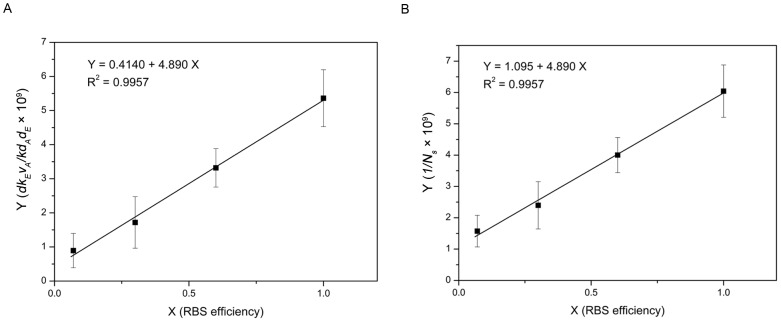
Figure 3. Linear relationship between RBS efficiency and model parameters.
Note: Ns is the viable cell density of engineered bacteria at steady state. The error bars represent the standard deviation of at least three replicates. (A) RBS efficiency (X) showed a linear relationship with the combined parameter  (Y): Y = 0.4140+4.890X; R2 = 0.9957. (B) RBS efficiency (X) also had a linear relationship with the parameter
  (Y): Y = 1.095+4.890X; R2 = 0.9957.

