
Figure 5.
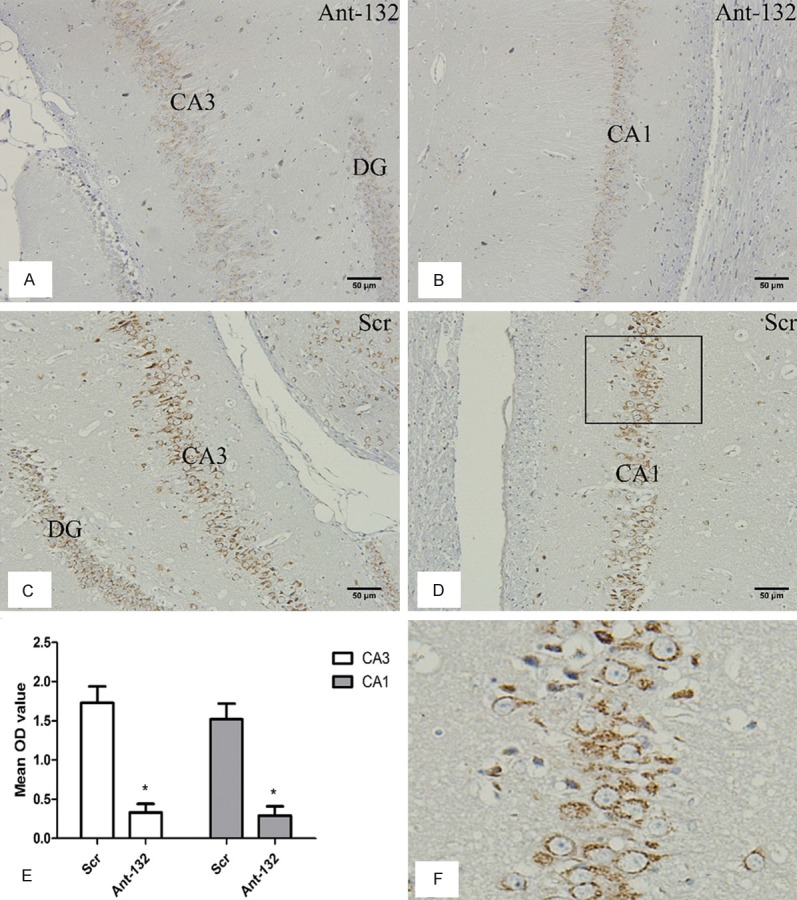
Bcl-2 expression at 14 days after SE induction. A and B: Bcl-2 expression in Ant-132 group. C and D: Bax expression in Scr group. DG, CA3 and CA1 indicated the subfield of the rat hippocampus. Bcl-2 expression was found in the cytoplasm of neurons. Scale bar: 50 μm. E: Mean OD of bcl-2 expression in the subfields of hippocampus (white column: CA3 region, gray column: CA1 region). F: Enlarged part of the selected region in D, and Bcl-2 expression was observed in the cytoplasm of neurons. *P < 0.05.