
Figure 7.
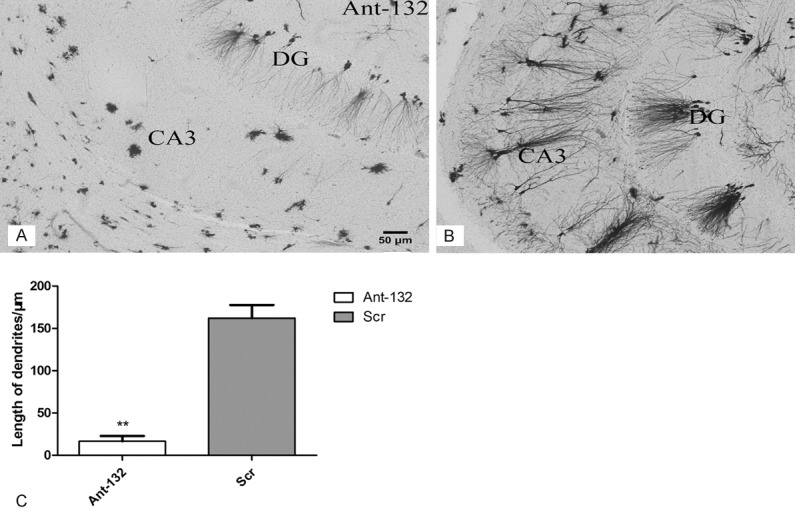
Dendritic morphology of the hippocampus by Golgi staining. A: Morphology of the dendrites in Ant-132 group; B: Morphology of the dendrites in Scr group; C: Mean length of the dendrites in CA3 region. White column: Ant-132 group; gray column: Scr group. **P < 0.01. Scale bar: 50 μm.