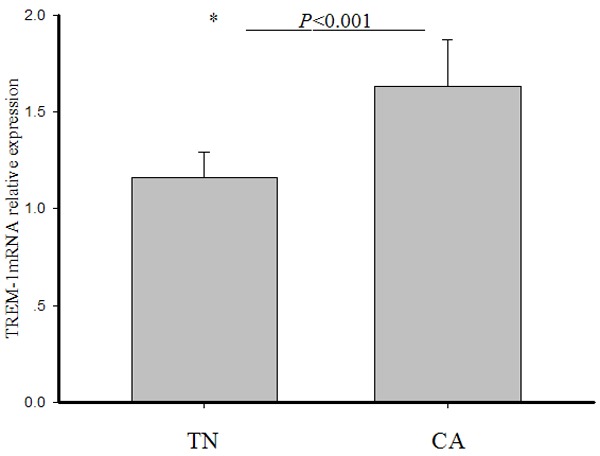
Figure 4.

Relative mRNA expression of TREM-1 in leukocytes. Following qRT-PCR, the expression levels of TREM-1 in each sample were calculated by 2-ΔCt method. mRNA expression level was normalized to β-Actin. Bars represent mean values ± standard errors of mean (SEM). The statistical significance was determined using a t-test. The asterisk represents a statistically significant difference between the two groups.
