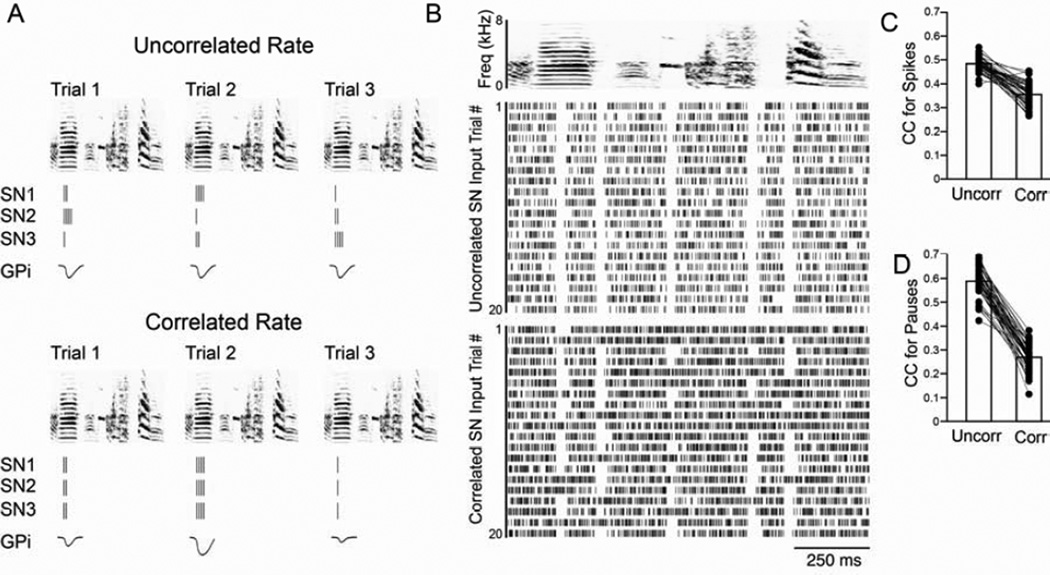
Figure 8. Increasing the rate correlation in SNs increases pause variability in GPi neurons.
(A) Illustration of how altering the degree of rate correlation among SNs could influence the output of GPi neurons. The top panel depicts the responses of three SNs (SN 1–3) and one GPi neuron to three different motif renditions (trials 1–3) when the rates of the SNs are uncorrelated. The SN responses are depicted as raster plots, the GPi neuron response is the inhibitory potential created by the SN inputs, with greater deflection from zero indicating a greater response. The bottom panel depicts the responses of these same neurons when the firing rates are correlated. Note that the GPi responses are predicted to be of similar size in the uncorrelated case, while the GPi responses in the correlated condition vary depending on the quantity of spikes in the SN burst. (B) Example of the output of the model. Top panel is a generic spectrogram. The activity of a hypothetical GPi neuron in response to uncorrelated (middle panel) and correlated (bottom panel) SN inputs is depicted as raster plots. The group data for 50 runs of the model shows that the CC of spikes (C) and pauses (D), like the data from GPi neurons, was higher for the uncorrelated, directed-like repetitions than for the correlated, undirected-like repetitions. See also Fig. S4.

