Figure 3.

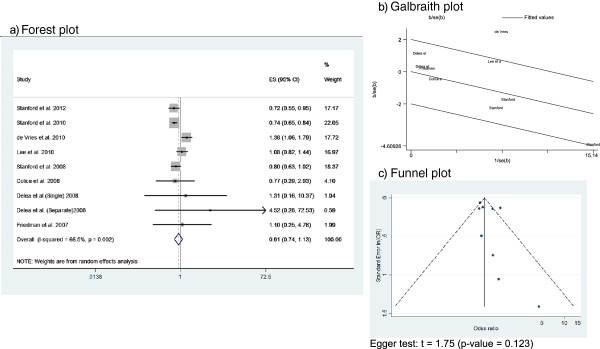
This figure includes Forest plot (a), Galbraith plot (b), and Funnel plot (c) of the asthma-related hospitalization meta-analysis.

This figure includes Forest plot (a), Galbraith plot (b), and Funnel plot (c) of the asthma-related hospitalization meta-analysis.