
Figure 6.
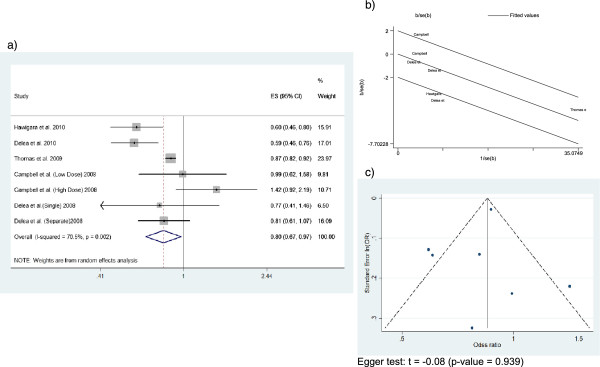
This figure includes Forest plot (a), Galbraith plot (b), and Funnel plot (c) of the asthma-related hospitalization or emergency department visits or systemic corticosteroid use.
Official websites use .gov
A
.gov website belongs to an official
government organization in the United States.
Secure .gov websites use HTTPS
A lock (
) or https:// means you've safely
connected to the .gov website. Share sensitive
information only on official, secure websites.
This figure includes Forest plot (a), Galbraith plot (b), and Funnel plot (c) of the asthma-related hospitalization or emergency department visits or systemic corticosteroid use.