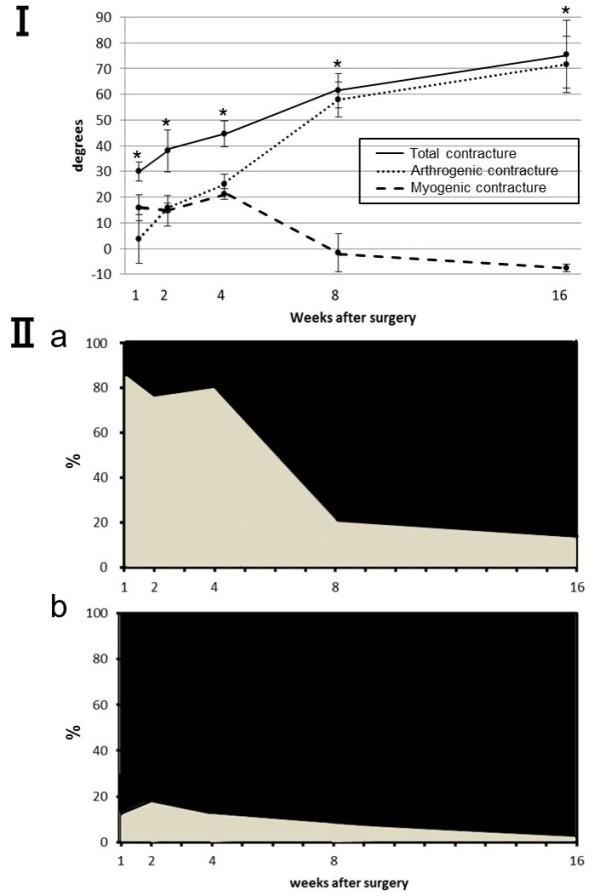
Figure 2.

The myogenic and arthrogenic contractures in immobilized knee joints over time. (I) Results in degrees. As the duration of immobilization increased, the myogenic contracture decreased and the arthrogenic contracture increased. Values are presented as mean ± SD. *Significant difference in the restriction of extension ROM between the immobilized and sham knees. *P < 0.05. (II) Results as presented as the percent contributions of the biarticular muscles to the total restriction: (II-a) results for the PT, PT components shown in gray; results for other components shown in black; (II-b) results for the PL, PL components shown in gray; results for other components shown in black. The PT contribution peaked after the first week and decreased thereafter. The peak contribution of the PL was significantly less than that of the PT.
