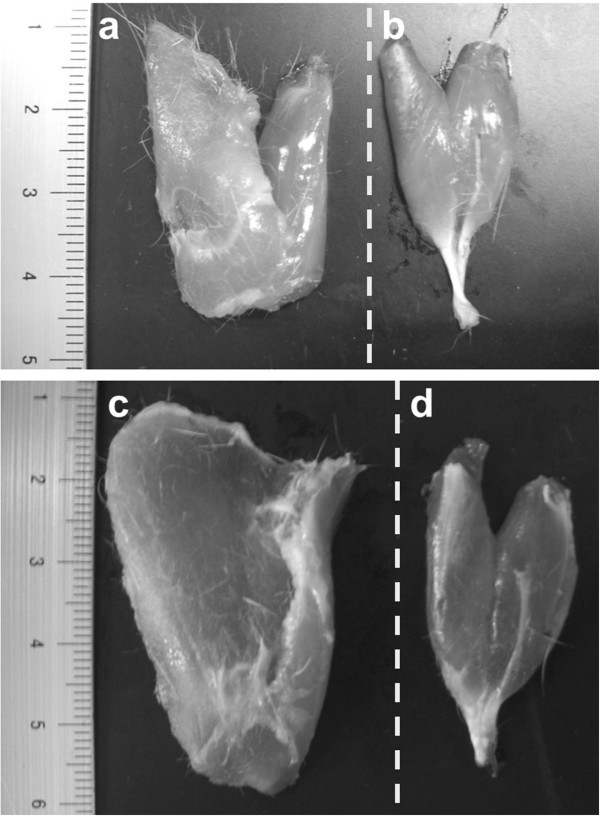
Figure 6.

Macroscopic observation of PT and PL of the control group after 1 and 16 weeks. (a) PT at the 1-week, (b) PL at 1 week, (c) PT at 16 weeks, (d) PL at 16 weeks. The dotted line shows the medial side. The muscle length of PT (including the hamstrings) were longer than that of PL (including the gastrocnemius).
