
Figure 1.
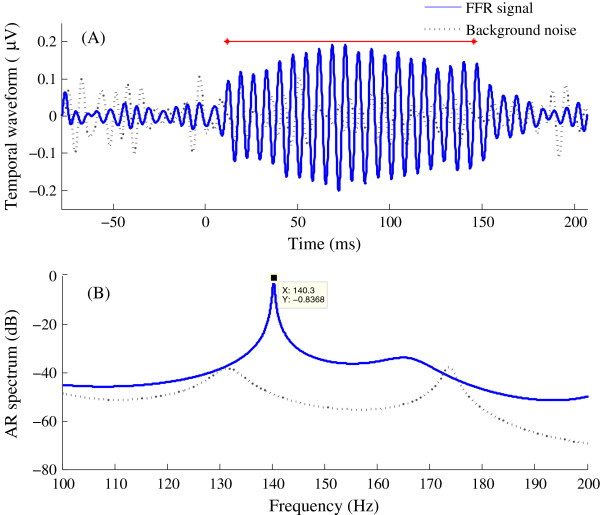
FFR temporal waveform and AR spectrum. Data are for a subject with FDL of 5.63 Hz. The solid lines show the time-domain waveform (A) and the AR spectrum of the FFR evoked by F_ref (140 Hz) in the 100% FDL condition (B). The interval 12 ~ 145.6 ms subjected to spectrum analysis is indicated by the red solid line in panel A. Noise floors are indicated by dotted lines. The background noise was recorded and analyzed in the same way as the FFR, except that the earphone was blocked to prevent the stimulus from reaching the eardrum.