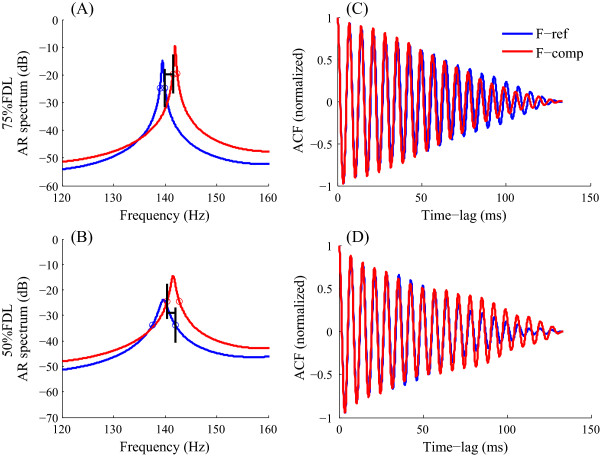
Figure 4.

FFR spectra and ACFs for 75% FDL and 50% FDL conditions. Data are from the first pair in Table 2 (Subject S2 in 75% FDL condition and Subject S8 in 50% FDL condition). Left-side panels (A, B) show the spectra and right-side panels (C, D) show the corresponding ACFs. Top to bottom panels, respectively, illustrate results in the 75% and 50% FDL conditions. Other conventions are the same as for Figure 2.
