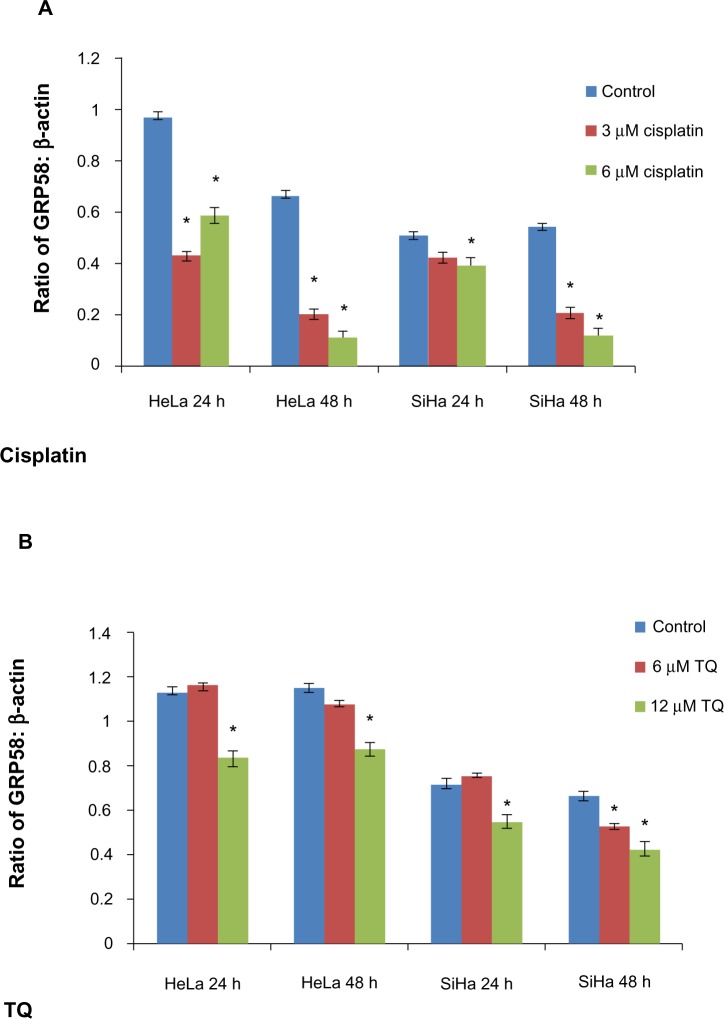
Figure 5.
GRP58 levels in HeLa and SiHa cell lines following treatment with cisplatin (A) and thymoquinone (B).
Notes: GRP58 density was quantified by densitometric analysis. Data are shown as the mean ± standard deviation of at least three independent experiments. *P<0.05 versus negative (untreated) control.
Abbreviations: TQ, thymoquinone; h, hours.

