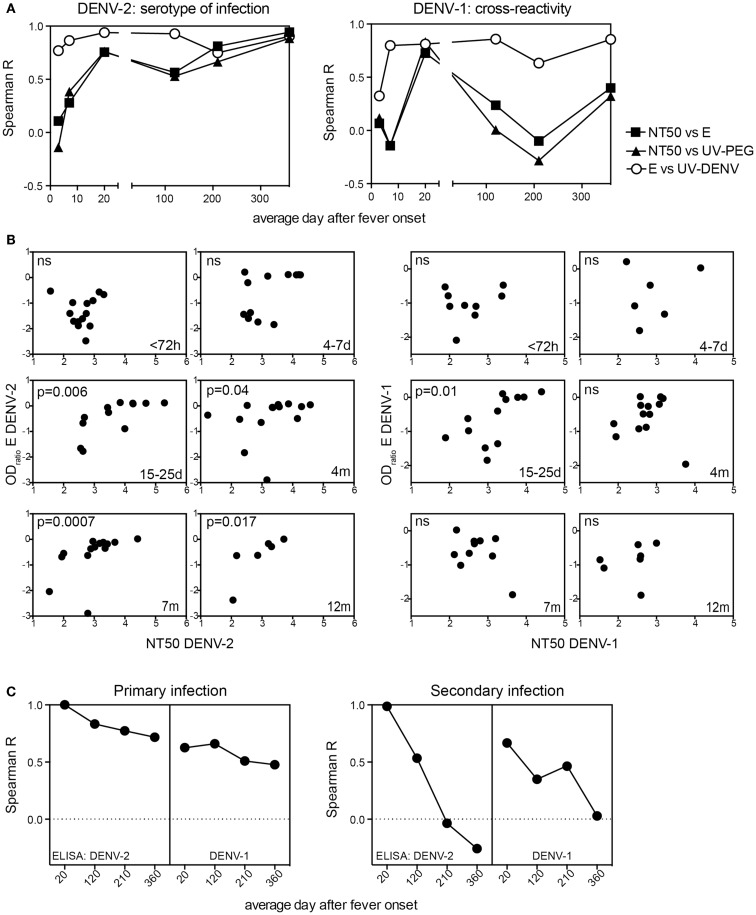
Figure 4.
Long-term correlation between E protein binding and NT50 for the serotype of infection. Correlations of E protein- and UV-DENV-ELISA titers with NT50 for plasma from primary and secondary patients were calculated individually for the indicated time points of disease. (A) Spearman R for the correlations between NT50 and ELISA titers are shown for each time point. (B) Graphs illustrating the data points used for the calculations of Spearman R shown in (A). Correlations for DENV-2 specific antibodies are shown in the graphs on the left and correlations for DENV-1 specific antibodies are shown in the graphs on the right. (C) Correlations between the highly cross-reactive E protein ELISA titer measured at day 15–25 for DENV-2 and the DENV-2 and DENV-1 E protein ELISA titers measured at time points indicated in the x axis were calculated. The correlations were calculated separately for primary and for secondary patients.

