Figure 5.
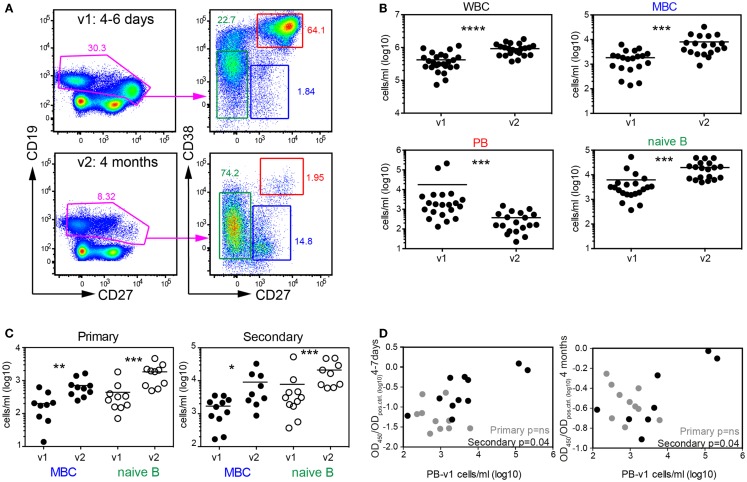
Systemic mobilization of naïve and memory B cell both during primary and secondary infection. (A) PBMCs from patients in the second cohort (Table 2) collected 4–7 days and 4 months after fever onset were stained for flow-cytometry analysis. Cells in the graphs were gated on live and CD14-negative cells. CD38 and CD27 expression on CD19+/low cells was then used to differentiate between memory B cells (MBC), naïve B cells, and plasmablasts (PB). Graphs from one representative patient are shown. (B) Quantification of the cell subsets illustrated in (A). (C) Data in (B) were separated into patient groups experiencing a primary or secondary infection. (D) Correlation between PB numbers detected at v1 and UV-DENV ELISA OD ratio (OD450/ODpos.control) measured at v1 and v2. (B–D) Each dot represents one patient; *p < 0.05, **p < 0.01, ***p < 0.001, ****p < 0.0001 (Wilcoxon matched-pairs signed rank test).

