
Figure 2.
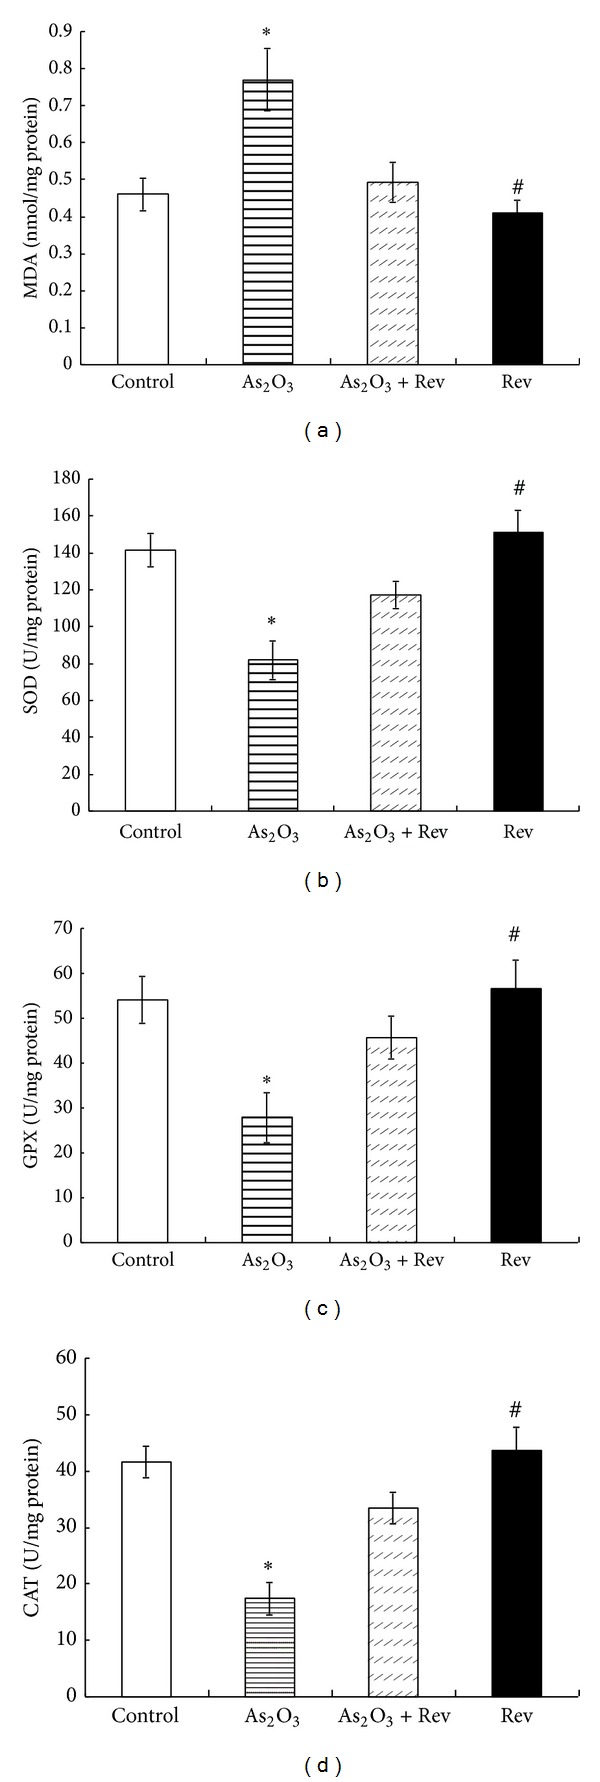
Arsenic-induced changes in SOD, GPX, CAT, and MDA in liver and their response to pretreatment with resveratrol. Values are mean ± SEM; *P < 0.05 versus control group and # P < 0.05 versus As2O3-treated group.
Official websites use .gov
A
.gov website belongs to an official
government organization in the United States.
Secure .gov websites use HTTPS
A lock (
) or https:// means you've safely
connected to the .gov website. Share sensitive
information only on official, secure websites.
Arsenic-induced changes in SOD, GPX, CAT, and MDA in liver and their response to pretreatment with resveratrol. Values are mean ± SEM; *P < 0.05 versus control group and # P < 0.05 versus As2O3-treated group.