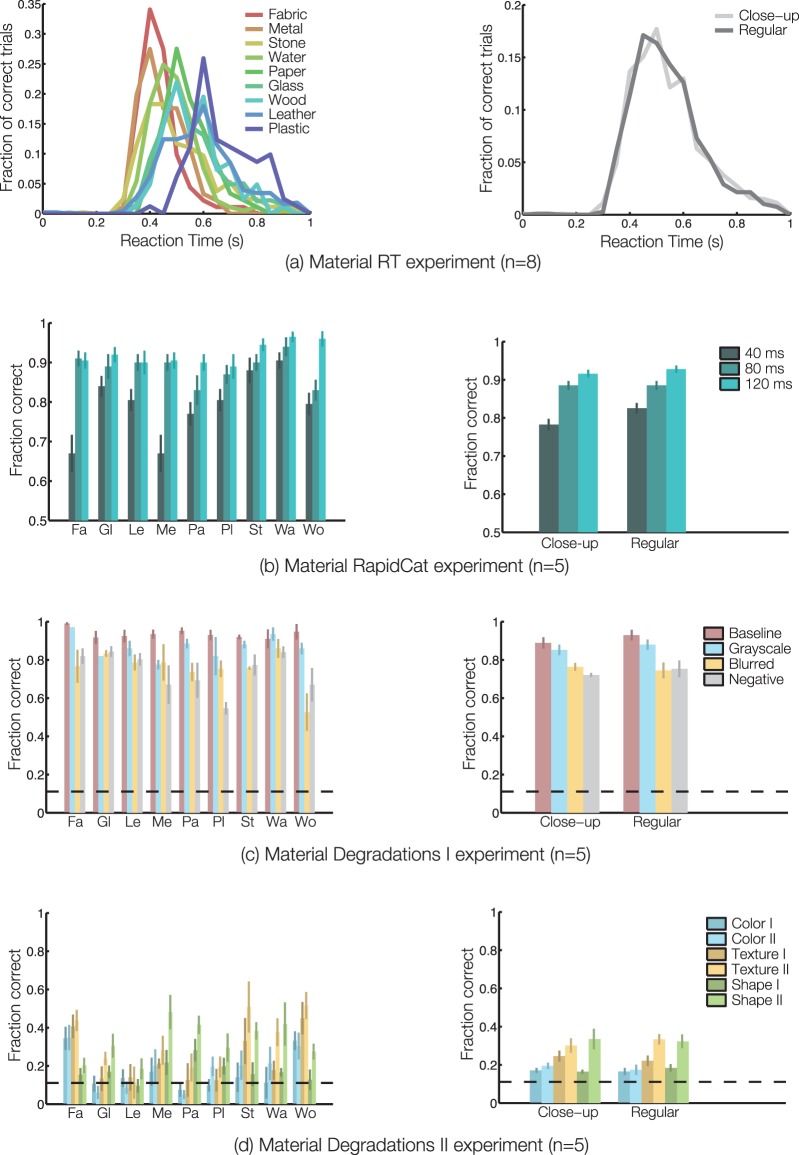
Figure 10.
Measuring the influence of material category and view type on material categorization. (a) RT distributions for correct trials, averaged across (left) one to six and (right) eight observers, are shown here for each (left) material category and (right) view type. (b) Accuracy at detecting material categories is shown here for all exposure durations as a function of (left) material category and (right) view type. Chance performance corresponds to 0.5, and error bars represent 1 SEM across (left) one to two and (right) five observers. (c–d) Accuracy at nine-way material categorization is shown here for all degradations as a function of (left) material category and (right) view type. Chance performance (0.11) is indicated by dashed black lines, and error bars represent 1 SEM across four observers in the Baseline condition, three observers in the Grayscale and Blurred conditions, two observers in the Negative condition, and five observers in all conditions of (d). The influence of material category should be interpreted cautiously as we lack sufficient statistical power (e.g., n = 1 for fabric and plastic RT curves). Meanwhile, it is safe to conclude that there were no significant effects of view type.

