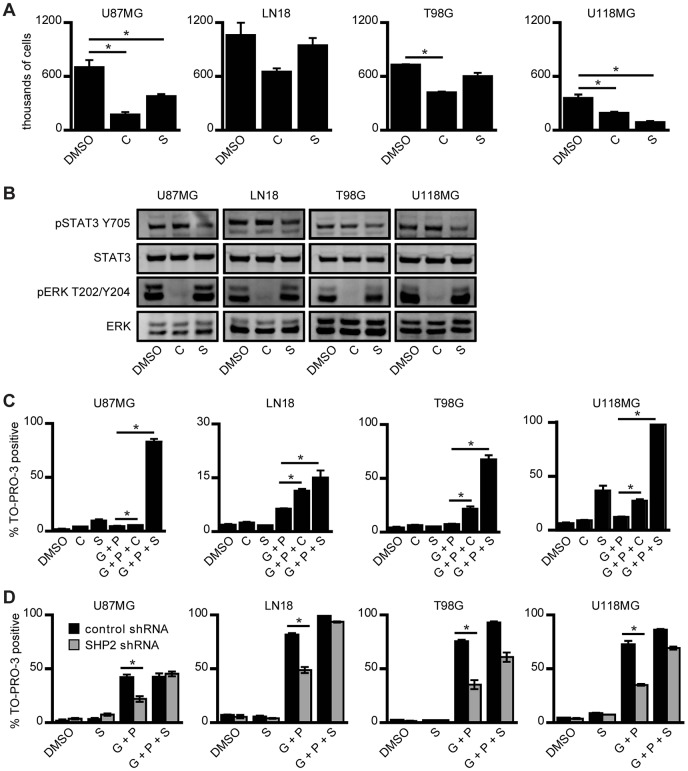
Fig. 2.
ERK and STAT3 pathways both control proliferation and survival of GBM cells. (A) U87MG, LN18, T98G and U118MG cells were seeded at 100,000 cells/well and treated 24 h later with 6 µM CI-1040 (C), 4 µM Stattic (S) or DMSO as a control (DMSO) for 72 h prior to cell counting. Counts are represented as mean ± s.e.m. (n = 3); *P<0.05. (B) The indicated cell lines were treated with the same concentrations of inhibitor as shown in A for 30 min prior to lysis. Lysates were analyzed by western blotting with antibodies against the indicated proteins. Images are representative of three sets of biological replicates. (C) The indicated cell lines were treated with 6 µM CI-1040 (C) or 4 µM Stattic (S), as in A, or with 10 µM gefitinib + 1 µM PHA665752 (G+P), with 10 µM gefitinib + 1 µM PHA665752 + 6 µM CI-1040 (G+P+C), with 10 µM gefitinib + 1 µM PHA665752 + 4 µM Stattic (G+P+S), or with DMSO as a control (DMSO). The gefitinib concentration in this set of experiments was lower than that used in the experiments shown in Fig. 1B and lower than the concentration used in the experiments shown in panel D, in order to reduce cellular death in response to G+P treatment. After 96 h, the percentage of TO-PRO-3-positive cells was measured by flow cytometry (n = 3); *P<0.05. (D) The indicated cell lines expressing control or SHP2-targeting shRNA were treated with DMSO as a control (DMSO), with 4 µM Stattic (S), with 20 µM gefitinib + 1 µM PHA665752 (G+P), or with 20 µM gefitinib + 1 µM PHA665752 + 4 µM Stattic (G+P+S). After 72 h, the percentage of TO-PRO-3-positive cells was measured by flow cytometry (n = 3); *P<0.05.

