
Figure 7.
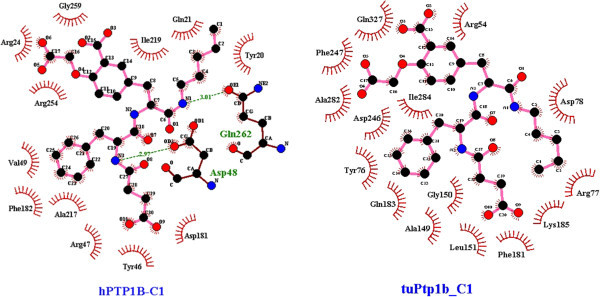
Comparison in the binding site of hPTP1B (left) and of TuPTP1B (right) to the peptidomimetic compound 1. The binding pockets are visualizaed by LigPlot+ v.1.4. The ligands and protein side chains are shown in ball-and-stick representation, with the ligand bonds coloured in pink. Hydrogen bonds are shown as green dotted lines with H-bond lengths. Residues with direct/hydrophilic contacts are colored in green with brown backbone whereas ones with indirect/hydrophobic interactions are colored in black and indicated with the red spoked arcs.