
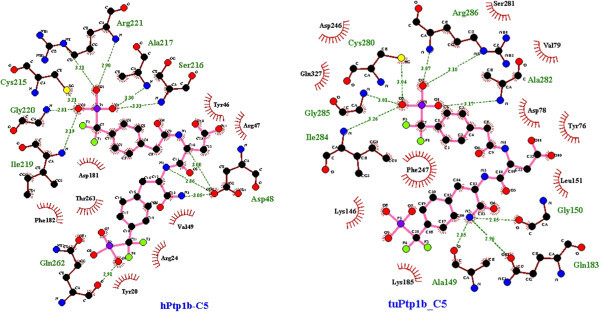
Figure 9.
Comparison of the binding pocket of hPTP1B (left) and Tupaia PTP1B (right) for compound 5. The analysis and illustration were made by using LigPlot+ v.1.4.
Official websites use .gov
A
.gov website belongs to an official
government organization in the United States.
Secure .gov websites use HTTPS
A lock (
) or https:// means you've safely
connected to the .gov website. Share sensitive
information only on official, secure websites.
Comparison of the binding pocket of hPTP1B (left) and Tupaia PTP1B (right) for compound 5. The analysis and illustration were made by using LigPlot+ v.1.4.