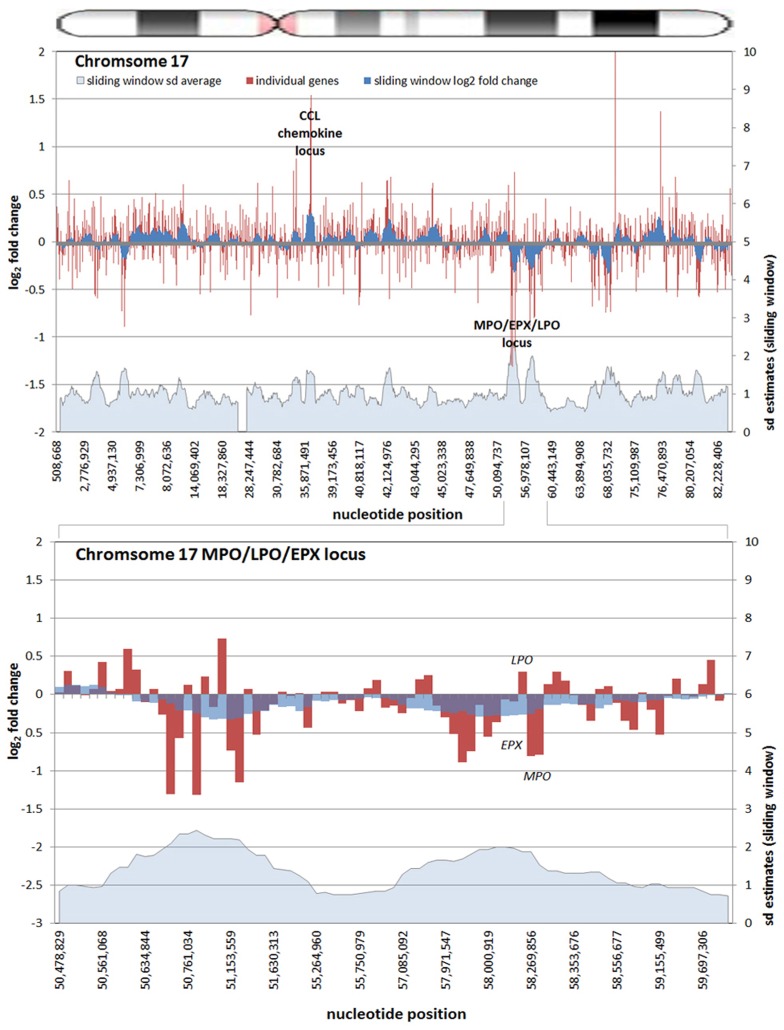
FIGURE 3.
Differential gene expression patterns cluster over large linear genomic regions in A. phagocytophilum-infected human peripheral blood neutrophils. The top panel shows human chromosome 17; the bottom panel shows the MPO/EPX/LPO locus on human chromosome 17 and the large genomic region that is upregulated with infection. The chromosome ideogram is shown at the top. Red bars (left axes) represent differential transcription of individual genes, including some replicates; the dark blue zones (left axes) show the sliding window average log2-fold differential transcription over the contiguous 9–11 genes (or 0.38–1.25 Mb). The light blue zone at the bottom (right axis) shows the sliding window average over the same region for estimated SDs of log2-fold differential transcription at each gene or gene feature. Data re-analyzed from Borjesson et al. (2005) www.ncbi.nlm.nih.gov/geo, accession no. GSE2405.

