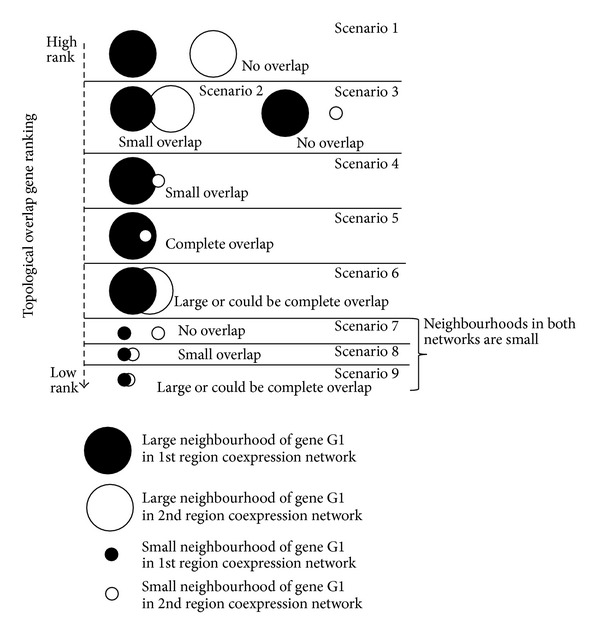
Figure 4.

Ranking of low TO genes. Nine possible scenarios of how neighborhoods overlap when considering neighborhood size and neighborhood overlap size of a gene, simultaneously, in two regional coexpression networks. Scenarios 1, 2, and 6 occur if the neighborhood of a gene in both regional networks is large and either they have zero (scenario 1), small (scenario 2), or large/complete (scenario 6) overlap of their direct neighbors. In scenarios 3, 4, and 5, the gene has a large neighborhood in one network and a small neighborhood in the other coexpression network. This also could lead to three possible kinds of overlap: zero (scenario 3), small (scenario 4), or large/complete overlap (scenario 5). Finally, in scenarios 7, 8, and 9, both neighborhoods of the gene are small and could have either zero (scenario 7), small (scenario 8), or large/complete overlap (scenario 9). The scenarios at the top of the figure have a higher rank than the ones at the bottom. Scenarios 1, 2, and 3 have a higher rank because the gene has either (1) a large neighborhood in both regional networks but small/no overlap of its neighbors or (2) large difference of its neighborhood in the two regional coexpression networks and no overlap of its neighbors whatsoever. Scenarios 4 and 5 have a large difference in neighborhoods but small or complete overlap of their neighbors. A gene is ranked the highest if it has a large difference in its neighborhood size and no overlap of its neighbors. This gene is assumed to have high activity (as indicated by the large neighborhood size) yet different biological roles (as indicated by the zero overlap of its neighborhoods) in the two different regions.
