
Figure 1.
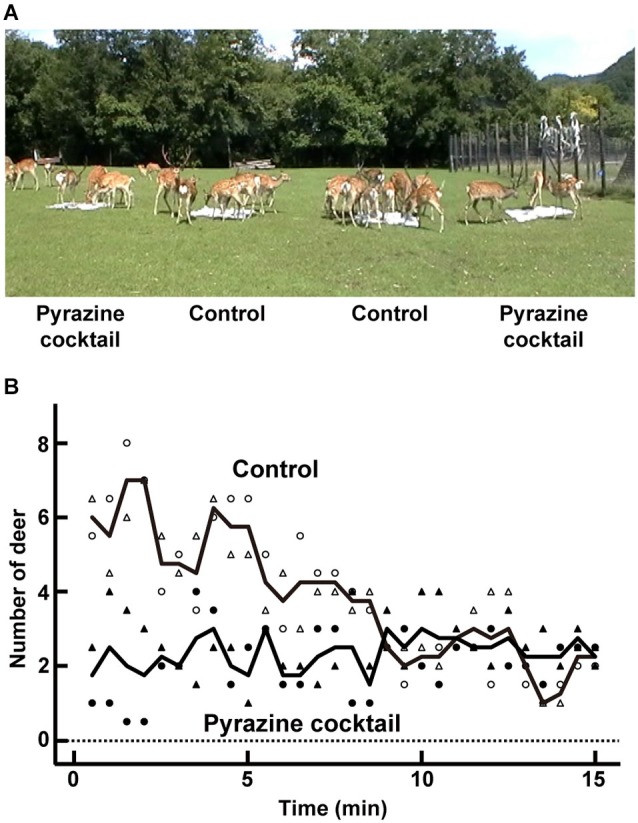
Feeding trial. (A) An average of 24 deer participated in the feeding trial at the deer park in Nishiokoppe, Hokkaido. The pyrazine cocktails were placed in two of the four feeding areas. (B) Average changes in the number of deer surrounding the pyrazine cocktail (closed symbols) or control feeding area (open symbols). The numbers were plotted by counting the deer near in each feeding area every 30 s. Symbols of circle and triangle indicate the average number from two feeding areas per odor condition in the trials in August and September, respectively. Lines show the average values from the both trials.