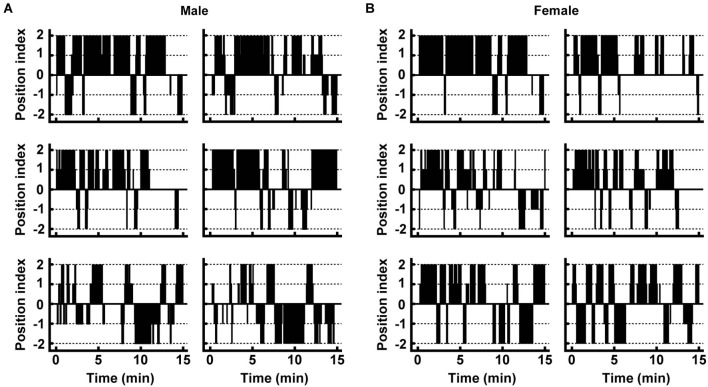
Figure 2.
Movement of individual male and female deer in the trial. (A,B) Typical movements are shown for males and females. Plots of the position index were made at every 2.5-s time point. Positive and negative numbers of the position index indicate the presence of the individual near the control and pyrazine cocktail feeding areas, respectively (see Section Materials and Methods for details).

