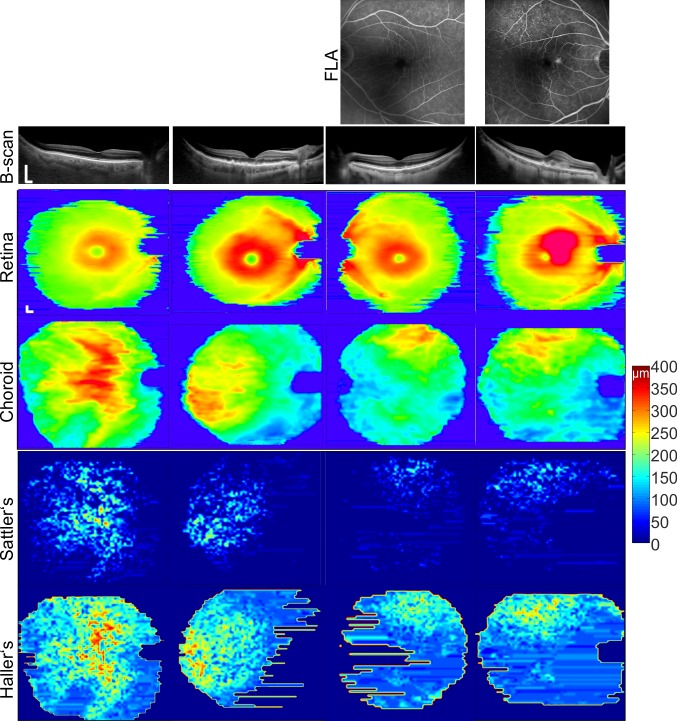
Figure 1.
Thickness maps for the retina, choroid, and Sattler's and Haller's layers for representative eyes in each group. Columns from the left are a healthy eye and the disease severities: intermediate AMD, intermediate AMD with its nAMD fellow eye. In the healthy eye the choroid and its sublayers are thickest below the macula. Bar represents 0.5 mm.

