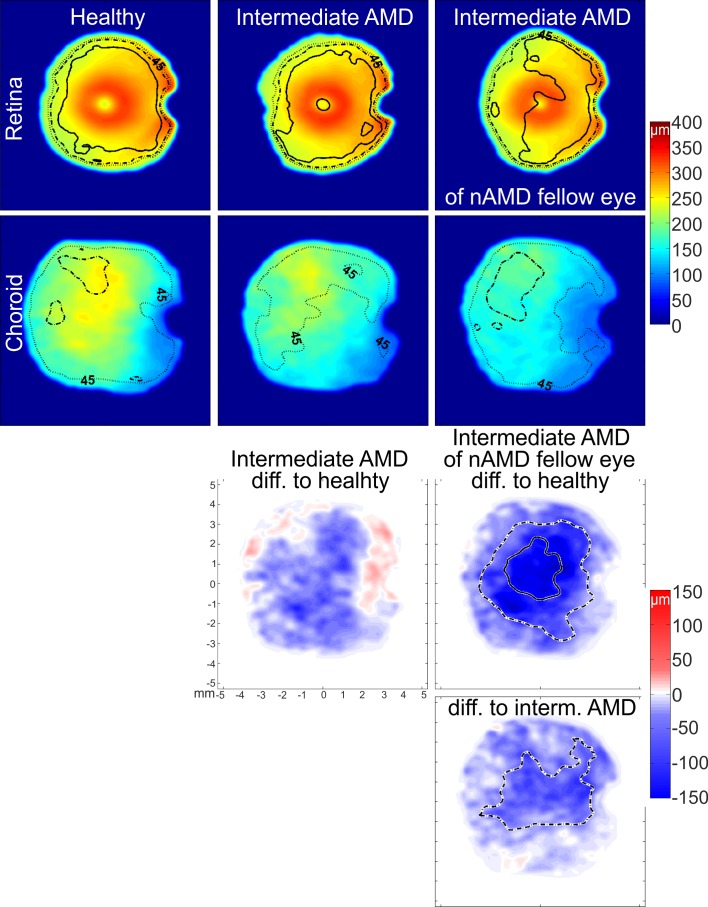
Figure 2.
Compound thickness maps for the retina and the choroid and their respective difference maps for the three disease groups. Numbers of averaged eyes are given in the Table. Thickness maps display contour lines for 45% (dotted), 30% (broken), and 15% (solid) coefficient of variation. Difference maps for the choroidal thickness of each disease group and the healthy eyes and for choroidal thickness between both intermediate AMD groups demonstrate the location of significant difference between groups found by post hoc testing. Broken and solid contour lines represent significant differences of P < 0.05 and P < 0.001, respectively.

