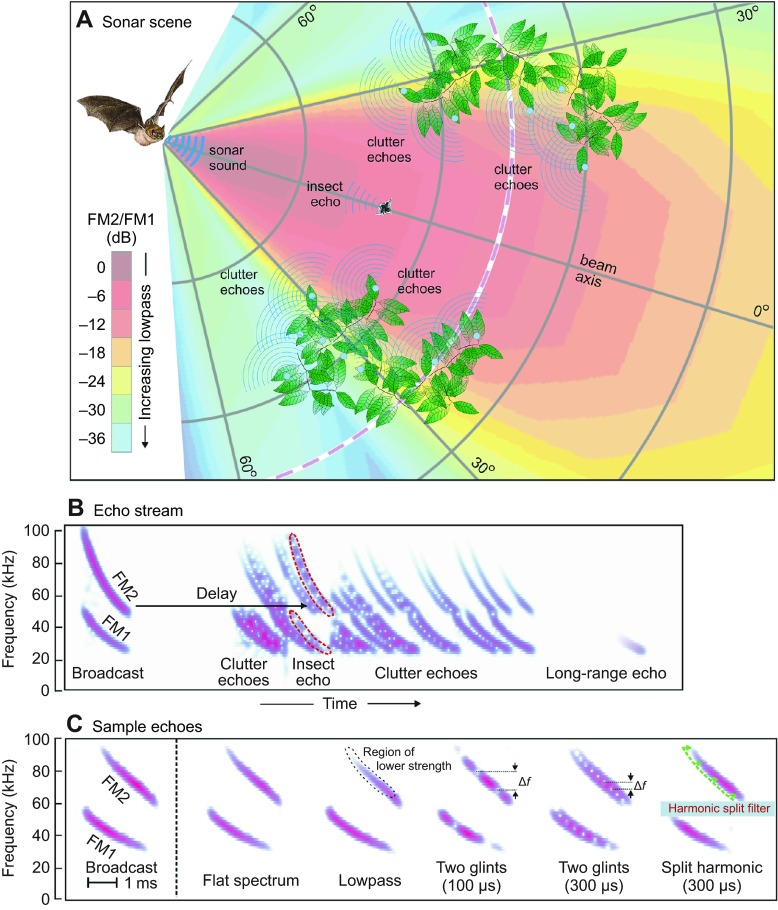
Fig. 1.
Representation of sonar scene. (A) Sonar scene showing bat, broadcast beam, insect and surrounding vegetation (clutter). FM broadcast contains full emitted frequency content (FM1, FM2) only immediately in front of the bat's mouth (dark red sector of beam; beam color depicts the amplitude ratio of FM2/FM1). Higher frequencies (FM2) are progressively weakened off to the sides and farther away (see color scale). The insect is a compact object, while screens of vegetation are extended surfaces containing numerous reflecting points (many blue circles). The spectrum of echoes is determined mainly by the spectrum of the incident sound, which depends on the object's location in the emitted beam. (B) Spectrograms illustrating the stream of echoes from the scene show FM sweeps in broadcast sound (left) and the sequence of echoes at progressively longer delays. Target and clutter echoes are mixed together. The target at long range is detected from the lowest frequencies of 25–30 kHz in FM1, because only these travel far through the air. (C) Spectrograms of sample echoes used in experiments on delay perception and clutter. Echo can have a flat spectrum or be modified by lowpass filtering, by overlapping glint reflections (nulls spaced at Δf intervals reciprocal to glint spacing) or by deliberate splitting of harmonics at different harmonic delays (e.g. FM2 300 μs later than FM1).

