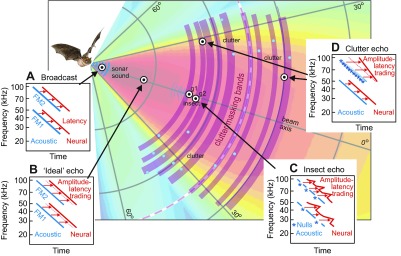
Fig. 3.

Acoustics of the sonar scene from Fig. 1A showing only the reflecting points (blue circles). Echoes from vegetation create clutter bands (curved purple arcs) that can obscure (i.e. mask) the presence of target echoes if they arrive at the same delays. Insets (A–D) illustrate the effects of object location on inner-ear acoustic (blue) auditory system neural spectrograms (red) of echoes from representative reflecting points (bullseyes). Auditory spectrograms have a logarithmic vertical frequency axis, which straightens lines tracing FM1 and FM2 compared with the curved sweeps shown in Fig. 1B. (A) Emitted sound contains equal-strength FM1 and FM2 with an overall flat spectrum. The neural spectrogram (red) is uniformly later than the acoustic spectrogram (blue) because of the latency of neural on-responses. (B) The flat-spectrum ‘ideal’ echo from a nearby one-glint target is a weakened, delayed replica of broadcast. Its neural spectrogram (red) is slightly retarded relative to the broadcast neural spectrogram (dashed red sloping lines) because of amplitude–latency trading. (C) Ripple-spectrum echo from a two-glint insect (g1, g2) located straight ahead, which is kept on the beam's axis by the bat's tracking response. Regularly spaced weak points in the acoustic spectrogram show interference nulls (*). In the neural spectrogram, the weak nulls are transposed into locally longer latencies by amplitude–latency trading, giving the sloping red lines a zig-zag shape. (D) Echoes from off-side or distant clutter have lowpass spectra because of frequency-dependent beam width and atmospheric absorption. The neural spectrogram for progressively weaker higher frequencies in FM2 is both retarded in time and skewed in slope because of amplitude–latency trading.
