
Figure 1. Graphic representation of venous outflow dilation outcomes.
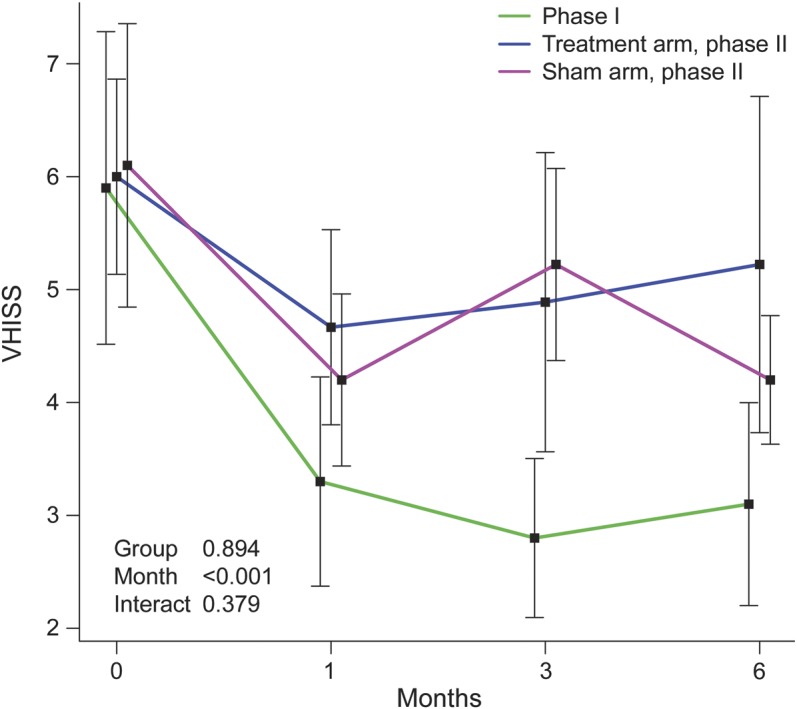
Changes in venous hemodynamic insufficiency severity score (VHISS) at 1, 3, and 6 months, compared to baseline, in phases 1 and 2 plotted by using mixed-effect model analysis. p Values in the plot are based on comparison between phase 2 groups. Time effect p values within groups are phase 1 (p < 0.0001), phase 2 treated arm (p = 0.02), and phase 2 sham arm (p = 0.04), respectively.