
Figure 2. Graphic representation of MRI lesion activity.
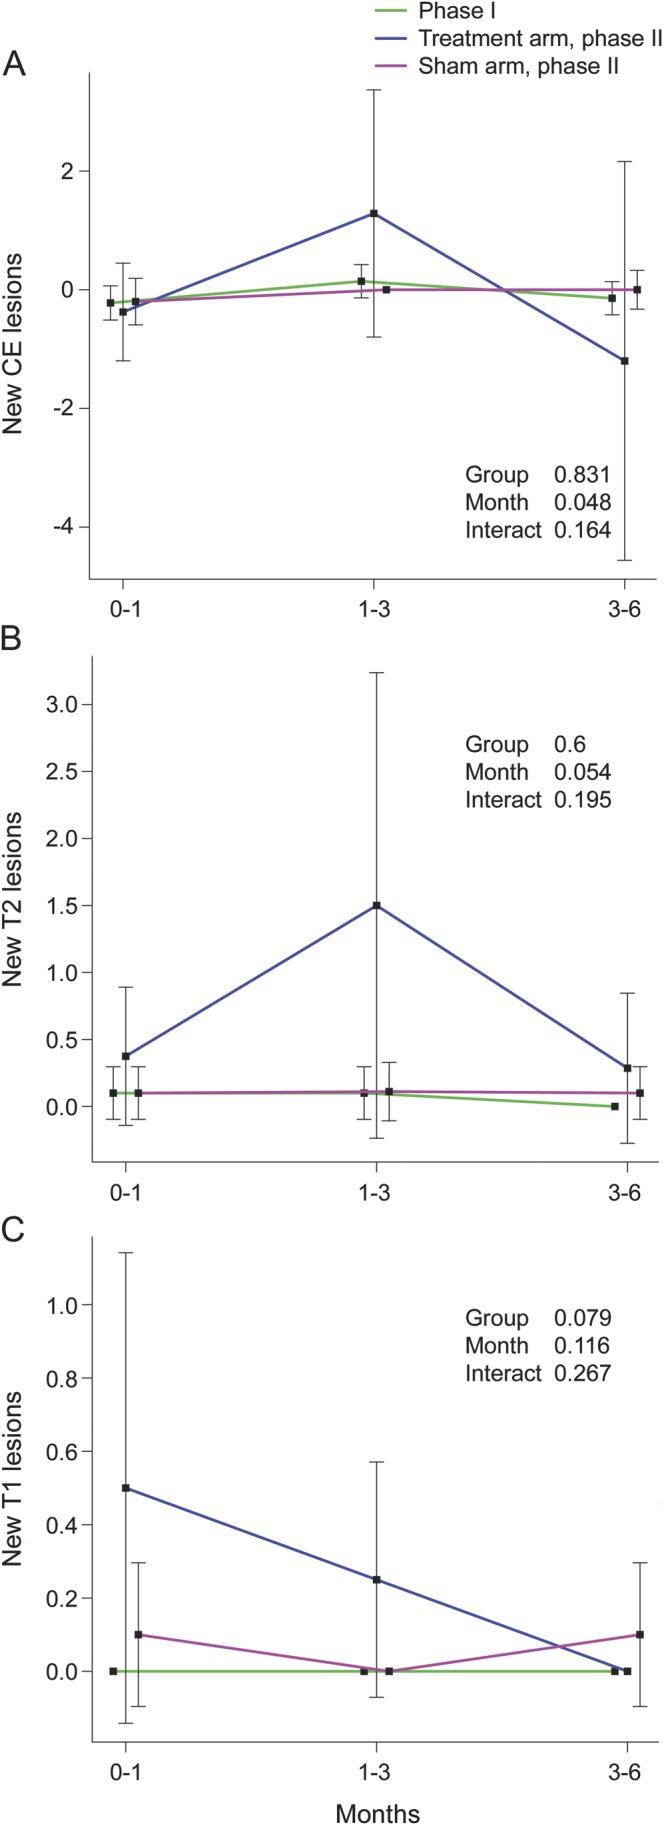
Changes in accumulation of mean new contrast-enhancing (CE) lesions (A), mean new T2 lesions (B), and mean T1 lesions (C), between 0–1, 1–3, and 3–6 months in phases 1 and 2, by using mixed-effect model analysis. Some means for new T2 and T1 lesions have standard error = 0 since only values of 0 are presented. p Values in the plot are based on comparison between the phase 2 groups. Time effect p values within these groups are for mean new CE lesions: phase 1 (p = 0.198), phase 2 treated arm (p = 0.593), and phase 2 sham arm (p = 0.766), respectively; for mean new T2 lesions: phase 1 (p = 0.617), phase 2 treated arm (p = 0.254), and phase 2 sham arm (p = 0.991), respectively; and for mean new T1 lesions: phase 2 treated arm (p = 0.057) and phase 2 sham arm (p = 0.776), respectively.