Figure 1.
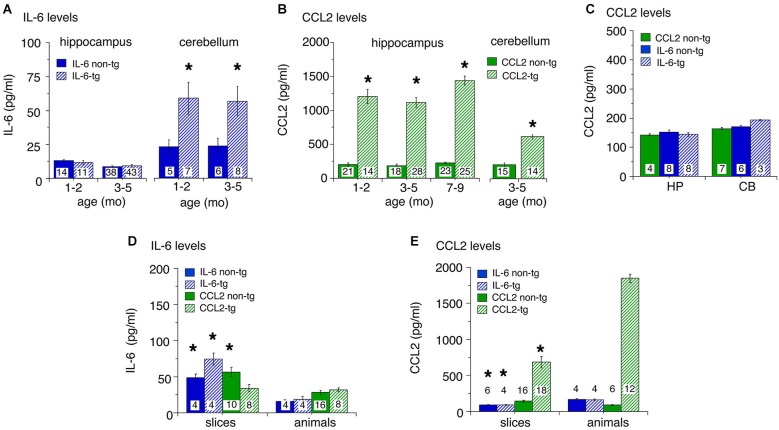
Levels of IL-6 and CCL2 protein in transgenic and non-transgenic hippocampus and cerebellum determined by ELISA. (A) IL-6 levels (mean ± SEM) in the hippocampus and cerebellum of IL-6 tg and non-tg mice at different ages. (B) CCL2 levels (mean ± SEM) in CCL2-tg and non-tg hippocampus and cerebellum at different ages. (C) CCL2 levels (mean ± SEM) in CCL2 non-tg hippocampus and cerebellum and IL-6 tg and non-tg hippocampus and cerebellum at 3–5 months of age. Numbers in bars are the number animals measured. * = statistically significant difference (p < 0.05, unpairedt-test) from non-tg of the same treatment group. (D,E) IL-6 (D) and CCL2 (E) levels in hippocampal samples with in vitro incubation (slices) or without (animals). For slices, numbers in bars are the number of samples measured (two samples/animal; left and right hippocampus). For animals, numbers in bars are the numbers of animals measured. * = statistically significant difference (p < 0.05, unpaired t-test) between slices and animal samples of the same genotype.

