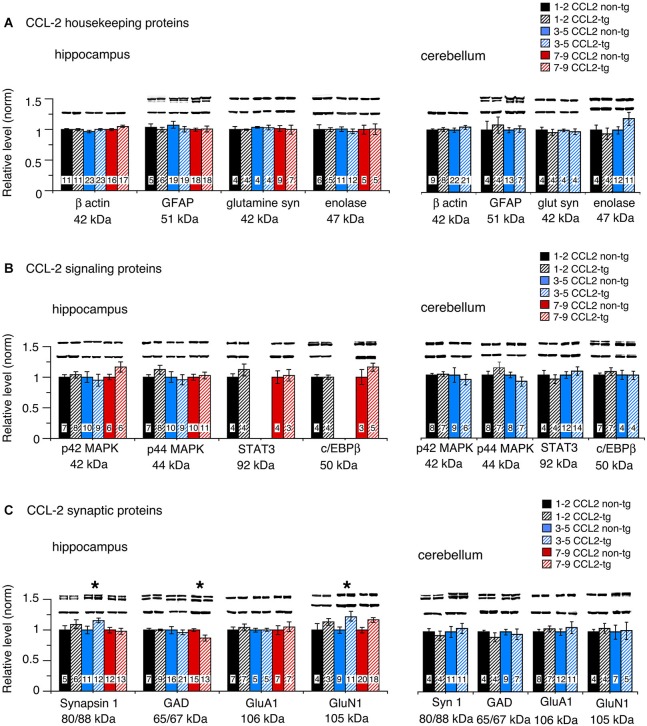
Figure 3.
Protein levels in hippocampus and cerebellum of CCL2-tg and non-tg mice at different ages determined by Western blot. (A) Mean (±SEM) values for levels of housekeeping proteins. (B) Mean (±SEM) values for levels of signal transduction proteins. (C) Mean (±SEM) values for levels of synaptic proteins. Representative Western blots are shown above the respective bar. Top blot is the protein indicated for the graph; bottom blot is β actin in the same lane. Numbers in bars are the number of animals measured. * = statistically significant difference between CCL2-tg and non-tg for the age group.

