
Fig. 6.
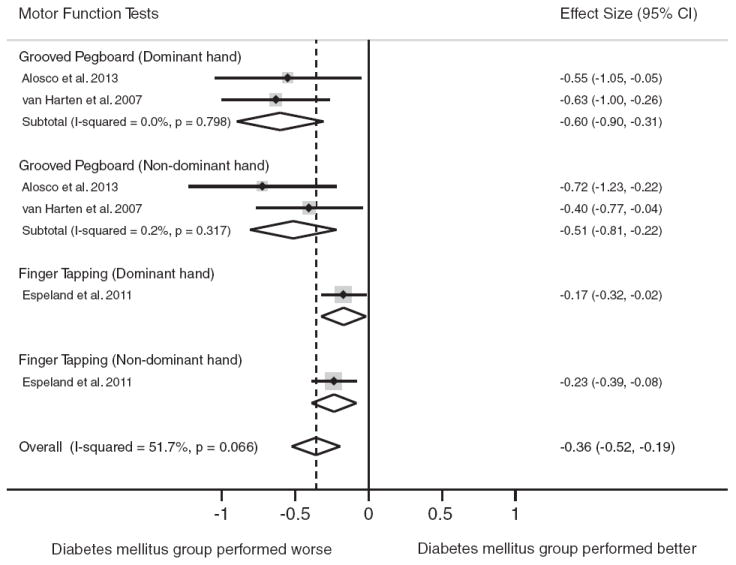
Forest plot depicting effect sizes for neuropsychological tests within the motor function domain. Shown are Cohen’s d effect sizes (95% CI) for each study reporting the test and the pooled Cohen’s d effect size (95% CI) for the neuropsychological test and domain. The dotted line represents the Cohen’s d pooled effect size for the motor function domain. The overall effect size for the motor function domain is −0.36 (−0.52, −0.19). A negative Cohen’s d effect size estimate reflects poorer cognitive performance among individuals with type 2 diabetes relative to the nondiabetic comparison group.