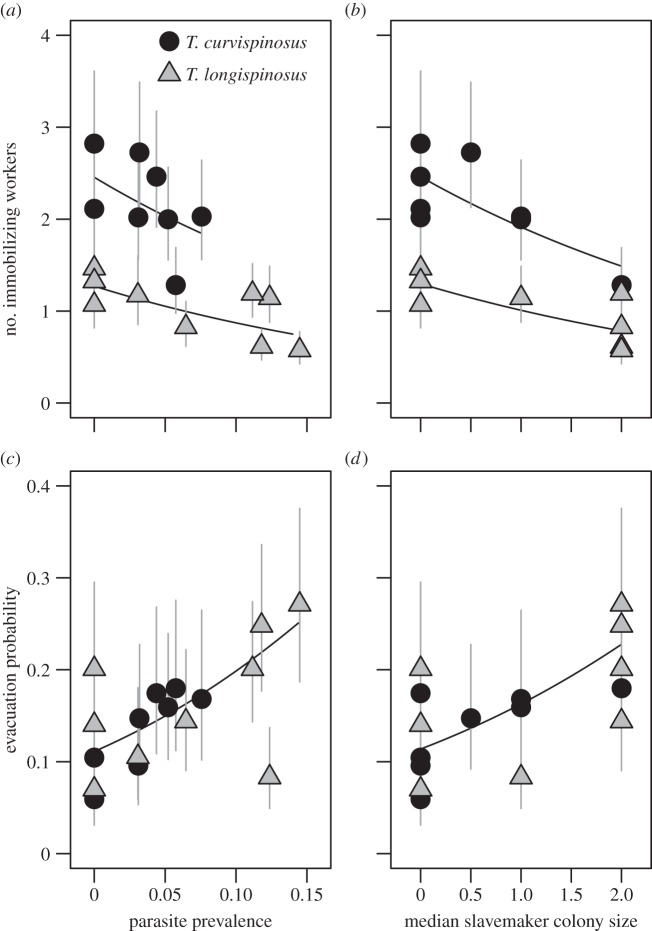
Figure 2.
Collective host defences in relation to social parasite pressure. Parasite pressure is represented by the parasite prevalence (a,c) and the median slavemaker colony size (b,d). Symbols represent the estimate ± s.e. per population, standardized for average host colony size (i.e. population estimates + colony size estimate × average host colony size). Regression lines are derived from the following GLMM estimates and back-transformed to the original data scale. (a) Estimate ± s.e. = −3.77 ± 1.31, z = −2.89, p = 0.004; (b) −0.25 ± 0.07, z = −3.49, p < 0.001; (c) 6.84 ± 2.40, z = 2.85, p = 0.004 and (d) 0.42 ± 0.14, z = 3.02, p = 0.003.

