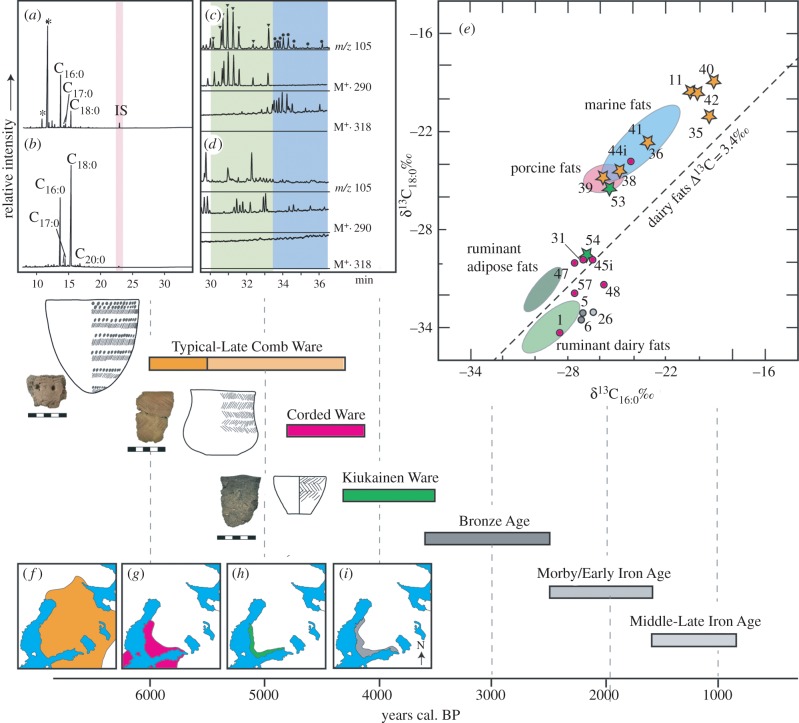
Figure 2.
Lipid compositions, aquatic biomarker distributions and stable isotope values of extracts from prehistoric sherds. Typical partial gas chromatograms of lipid extracts from (a) Comb Ware and (b) Corded Ware; CX:Y FA denotes fatty acid with carbon chain length X and degree of unsaturation Y, *denotes phthalate. Panels (c) and (d) are mass chromatograms from Comb and Corded Ware lipid extracts, respectively, analysed by GC/MS-SIM, showing the distribution of C18 (inverted triangle) and C20 (black circle) APAAs present only in (c). Panel (e) shows δ13C16:0 and δ13C18:0 values from Typical/Late Comb Ware (orange), Corded Ware (pink), Kiukainen Ware (green) and Metal Age (grey) residues; when shown as stars, this indicates aquatic biomarkers were also observed in the residue. Numbers refer to the KM-number, as assigned in table 1. Shaded reference ellipses derive from modern reference fats [21,22]. The timeline shows the archaeological cultures discussed here alongside actual sherds sampled and typical vessel forms (after [26–28]) (latter not shown to scale). Distribution maps show the geographical range of (f) Typical Comb Ware, (g) Corded Ware, (h) Kiukainen Ware and (i) Bronze Age cultures in the region (after [10,20,29]).

