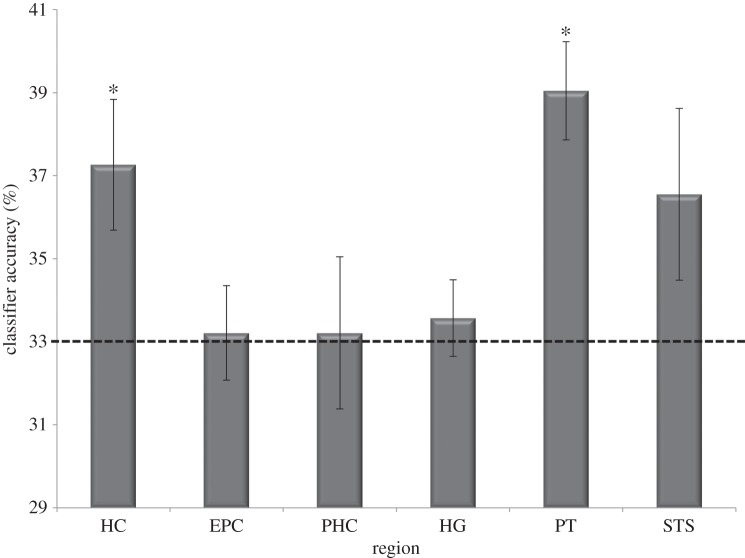
Figure 4.
Results of the MVPA analysis. The mean (±s.e. of mean) classifier performance (collapsed across both hemispheres) is shown. Chance was 33% (marked by the dotted line). HC, hippocampus; EPC, entorhinal/perirhinal cortex; PHC, parahippocampal cortex; HG, Heschl gyrus; PT, planum temporale; STS, superior temporal sulcus. (*p < 0.05.)

