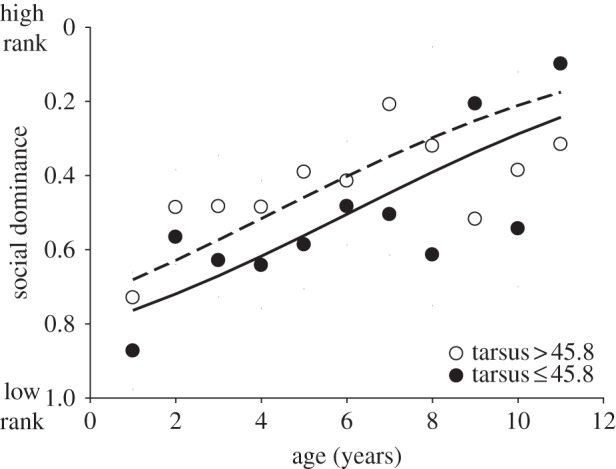
Figure 1.

Social dominance in relation to age and size (tarsus length). Statistical analysis was carried out using raw data, but for graphical purposes, individuals were grouped by tarsus size (tarsus ≤ 45.8; or >45.8) and age. Lines show the predicted values of the logistic regression in table 1 for the average tarsus length of each group (44.8 and 46.8). Low rank indicates high dominance.
