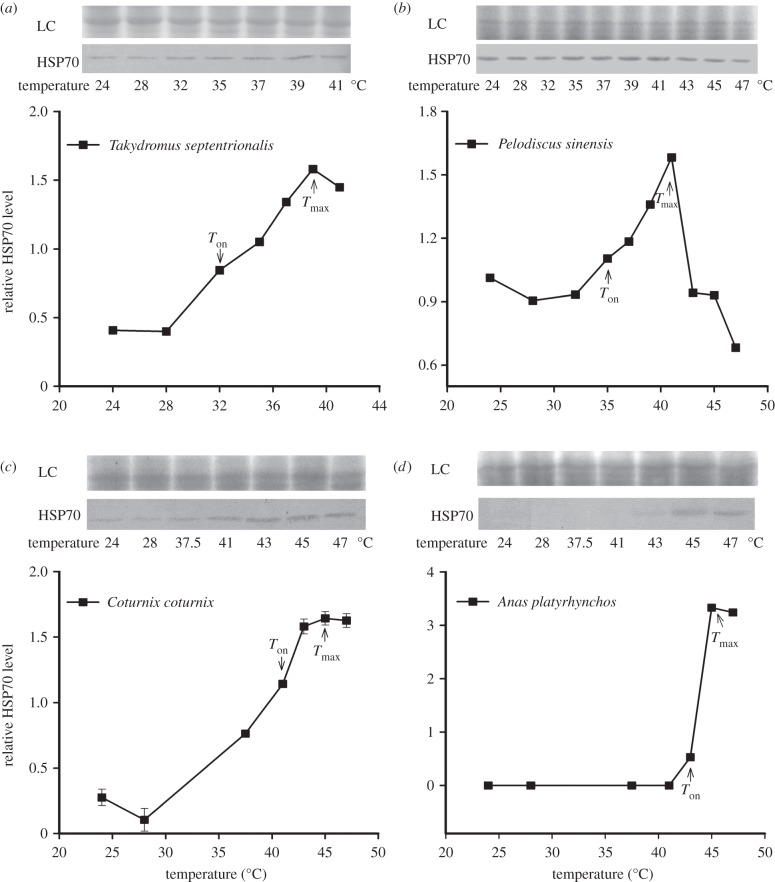
Figure 2.
Western blot analysis of HSP70 protein in the embryos of (a,b) two reptilian species and (c,d) of two avian species. Treatments are the same as in figure 1. Each lane of a 10% SDS–polyacrylamide gel was loaded with equal amounts of protein (123 µg for Takydromus septentrionalis, 50 µg for Pelodiscus sinensis, 221 µg for Coturnix coturnix, 528 µg for Anas platyrhynchos). HSP70 expression was quantified as the quotient between HSP70 band intensities and total protein intensities (the loading control of Coomassie blue staining, LC) in each lane. The first temperature at which the expression level was significantly higher than the control (24°C) was described as onset temperature (Ton) for HSP70 expression. The temperature at which the expression level of HSP70 was highest was described as maximal expression temperature (Tmax). Data are shown as means ± s.e. (n = 3 for each temperature treatment). Differences among mean values were determined using Tukey's post hoc test.

