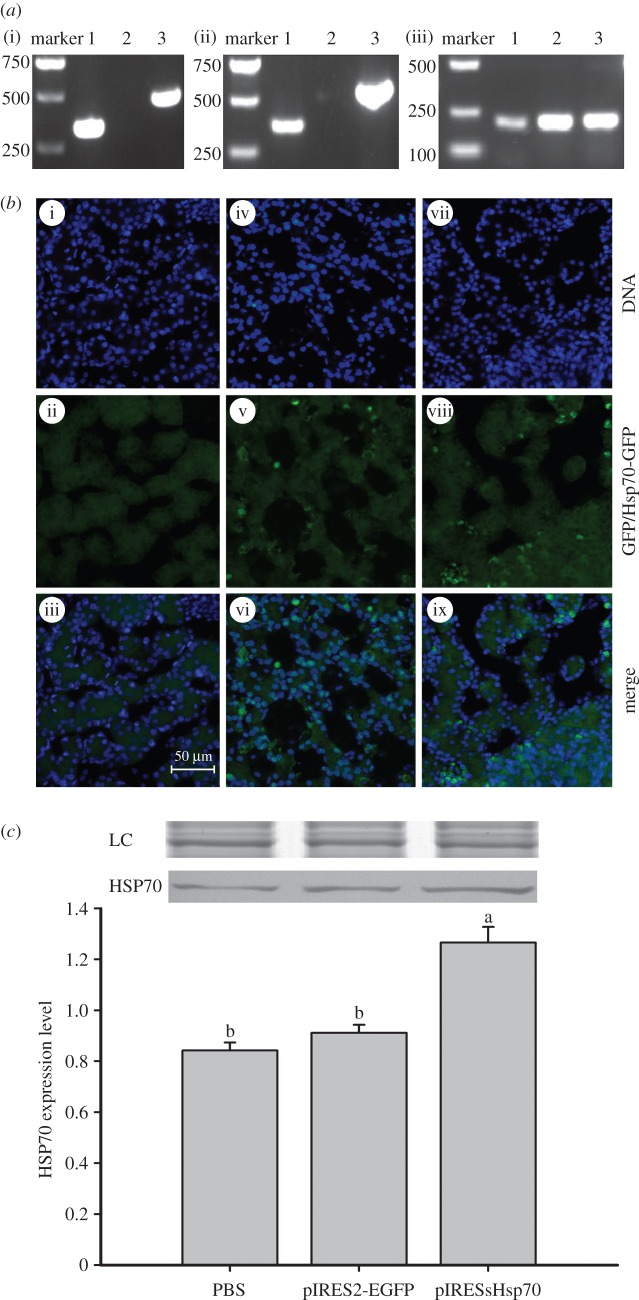
Figure 3.
Detection of the plasmids and the expression of PsHSP70 in the embryos of Pelodiscus sinensis. (a) hsp70 gene expression. Embryos injected with pIRESPsHsp70 (lane 1) or pIRES2-EGFP (lanes 2 and 3) were used. (i) Extracted DNA was used for PCR with primers specific for pIRESPsHsp70 (lanes 1 and 2) or specific for pIRES2-EGFP (lane 3); (ii) extracted RNA was used for PCR with the primers described in (a); (iii) extracted RNA was used for PCR with primers specific to β-actin (internal control). (b) Distribution and expression of plasmids. Embryos injected with either PBS (i–iii), pIRES2-EGFP (iv–vi) or pIRESPsHsp70 (vii–ix) were fixed and observed under fluorescence microscope for DAPI nuclear staining (i, iv, vii) with an exposure time of 20 ms or green fluorescence with an exposure time of 200 ms (ii, v, viii). (c) HSP70 expression in embryos injected with PBS, pIRES2-EGFP or pIRESPsHsp70. The loading amounts of total protein were all 300 µg. HSP70 expression was quantified as the quotient between HSP70 band intensities and total protein intensities (the loading control of Coomassie blue staining, LC) in each lane. Bands of LC were shown above the Western blots. Data are shown as means ± s.e. (n = 3 for each treatment). Means with different letters above the error bars are statistically different (Tukey's post hoc test).

