Figure 3.
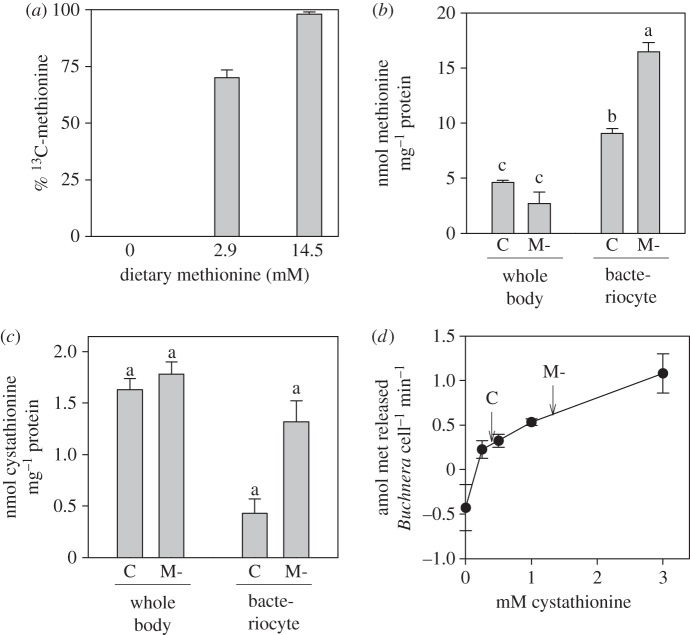
Metabolic basis of diet-dependent variation in methionine synthesis. (a) 13C-methionine content of aphids reared from day 2 to day 7 on diets with different methionine content, provided as 13C-methionine (4–6 replicates per treatment); 2.9 mM methionine is the concentration in the complete diet. (b,c) Concentration of methionine (b) and cystathionine (c) in whole body and bacteriocytes of aphids on complete diet (C) and methionine-free diet (M-), displayed as mean ± s.e. (10 replicates). ANOVA for methionine: tissue F1,36 = 244.82, p < 0.001; diet F1,36 = 22.16, p < 0.001; interaction F1,36 = 63.63, p < 0.001. ANOVA for cystathionine: tissue F1,36 = 306.37, p < 0.001; diet F1,36 = 59.85, p < 0.001; interaction F1,36 = 46.0, p < 0.001. (d) Variation in rate of methionine release by isolated Buchnera cells incubated with different concentrations of cystathionine, displayed as mean ± s.e. (five replicates). Arrows indicate the cystathionine concentration in bacteriocytes of aphids reared on the complete diet (C) and methionine-free diet (M-).

