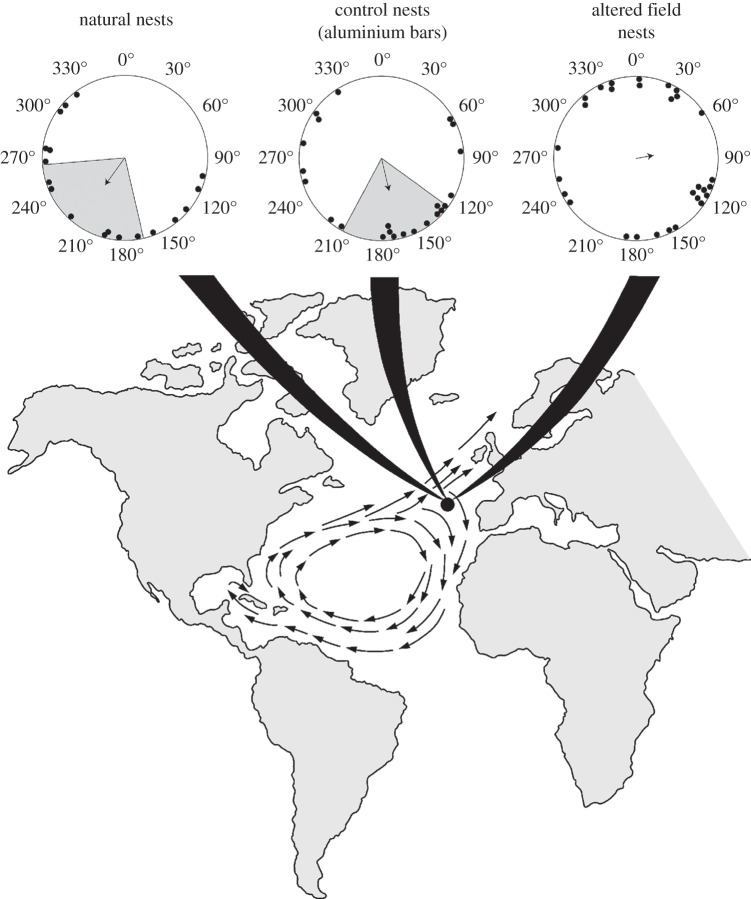
Figure 4.
Orientation of hatchlings exposed to a magnetic field that exists near the northeastern boundary of the North Atlantic subtropical gyre. The location where the field exists is indicated by the black dot on the map. ‘Natural nests’ indicate headings from turtles that incubated in undisturbed nests; ‘control nests (aluminium bars)’ depict headings from turtles that incubated in nests surrounded by non-magnetic aluminium bars. ‘Altered field nests’ depict headings from turtles that incubated in nests surrounded by magnets. In the circular orientation diagrams, each dot represents the mean heading of a single hatchling. The arrow indicates the mean direction of turtles in the group. The length of the arrow is proportional to the magnitude of the mean vector r, with the radius of the circle corresponding to r = 1. The shaded sectors inside the circular diagrams represent the 95% CIs for the two groups that were significantly oriented. Turtles that developed in natural nests were significantly oriented (Rayleigh test, r = 0.42, n = 18, p < 0.05) with a mean angle of 216°. Turtles from nests surrounded by aluminium bars were also significantly oriented (r = 0.39, n = 23, p < 0.05) with a mean angle of 167°. By contrast, turtles that developed in fields altered by magnets had orientation that was statistically indistinguishable from random (r = 0.17, n = 29, p = 0.42). Data are plotted relative to magnetic north, which is indicated by 0°.

