Figure 2.

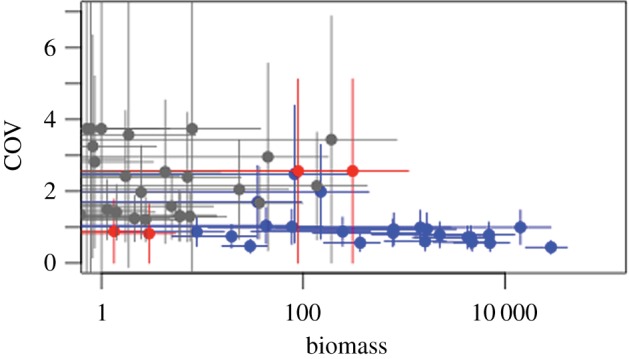
Relationship between COV (±s.d.) and mean (±s.d.) biomass. Core species showing density-dependence are shown in blue. Core species with no evidence of density-dependence in red. Transient species in grey.

Relationship between COV (±s.d.) and mean (±s.d.) biomass. Core species showing density-dependence are shown in blue. Core species with no evidence of density-dependence in red. Transient species in grey.