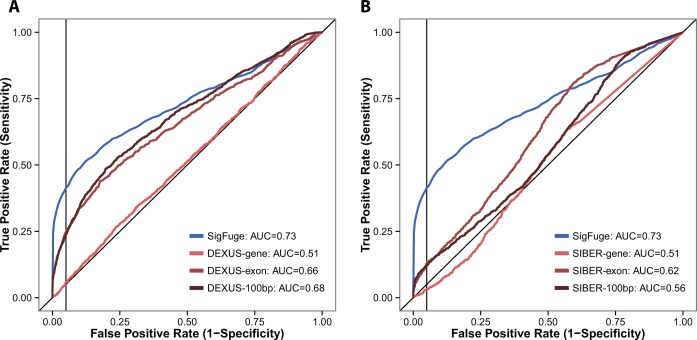
Figure 2.
ROC curves are shown for SigFuge and six competing approaches applied to 10 000 simulated gene loci. Comparisons are given for SigFuge p-values and (A) DEXUS I/NI indices and (B) SIBER BI indices at the gene, exon and 100bp window levels. The corresponding AUC is reported for each method in the legends, and vertical black lines are used to denote the 95% specificity cutoff.

