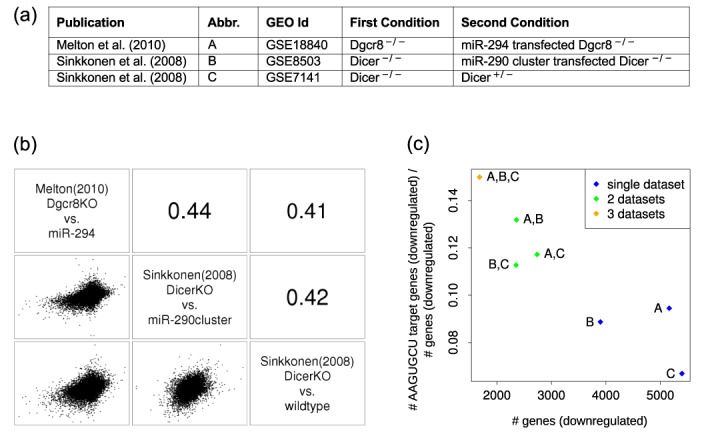
Figure 1.

Overview of the mRNA expression data sets—(a) Data sources. (b) Matrix of scatter plots (below diagonal) and Pearson's correlation coefficients (above diagonal) of per-gene log2 fold changes in pairs of experiments. The names of the individual data sets are shown on the diagonal. (c) Proportion of predicted targets of the AAGUGCU seed family of miRNAs (TargetScan aggregate PCT score based predictions (4)) among genes that are consistently downregulated in all three (orange), pairs (green) or individual data sets (blue) (indicated by the labels, key given in the ‘Abbr.’ column of the table in panel (a)), plotted against the number of genes that are consistently downregulated in all of the considered data sets.
