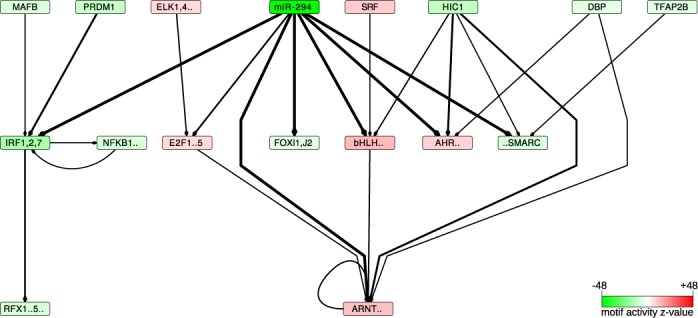
Figure 2.

The transcriptional network inferred to be affected by the miRNAs of the AAGUGCU seed family (represented by miR-294)—A directed edge was drawn from a motif A to a motif B if A was consistently (across data sets) predicted to regulate a TF b whose sequence specificity is represented by motif B. The thickness of the edge is proportional to the product of the probabilities that A targets b. For the clarity of the figure, only motifs with absolute z-values >5 and only edges with a target probability product >0.3 are shown. The intensity of the color of a box representing a motif is proportional to the significance of the motif (the corresponding  -values can be found in Supplementary Table S3). Red indicates an increase and green a decrease in activity, corresponding to increased and decreased expression, respectively, of the tagets of the motif when the miRNAs are expressed. The full motif names as well as the corresponding TFs are listed in Supplementary Table S7.
