
Figure 4.
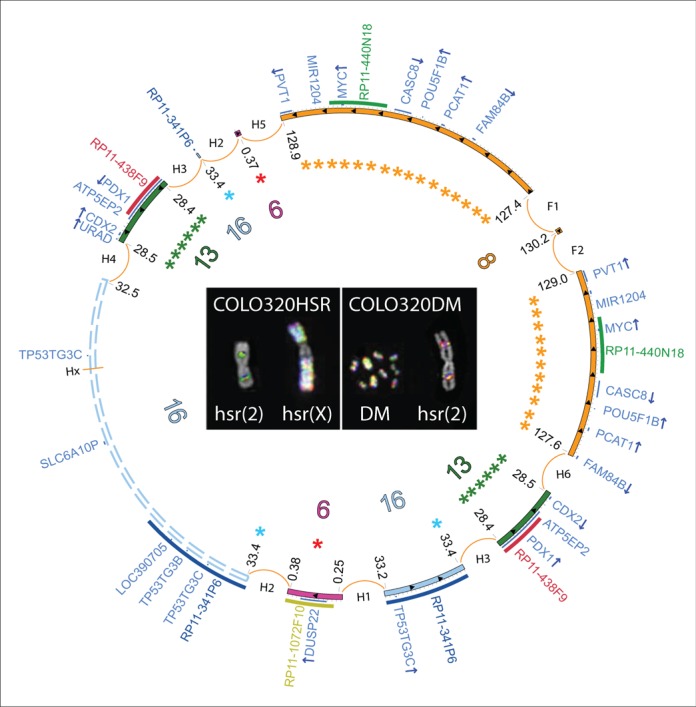
Circular amplicon structures shared by COLO320DM/HSR cell lines. Unscaled Circos plot representing the overall amplicon structure shared by COLO320DM/HSR. Chromosomes 6, 8, 13 and 16 fragments are shown as purple, yellow, green and light blue inner circular segments, respectively. Internal arrows indicate amplicon orientation. Asterisks indicate nested amplicons. Dashed lines represent the ambiguous structure of the 16p11.2 amplicon. Genes are in dark blue, with arrows corresponding to their transcriptional orientation. FISH images show co-localizing amplified probes, consistently colored in the outermost semicircular panels of the Circos plots.