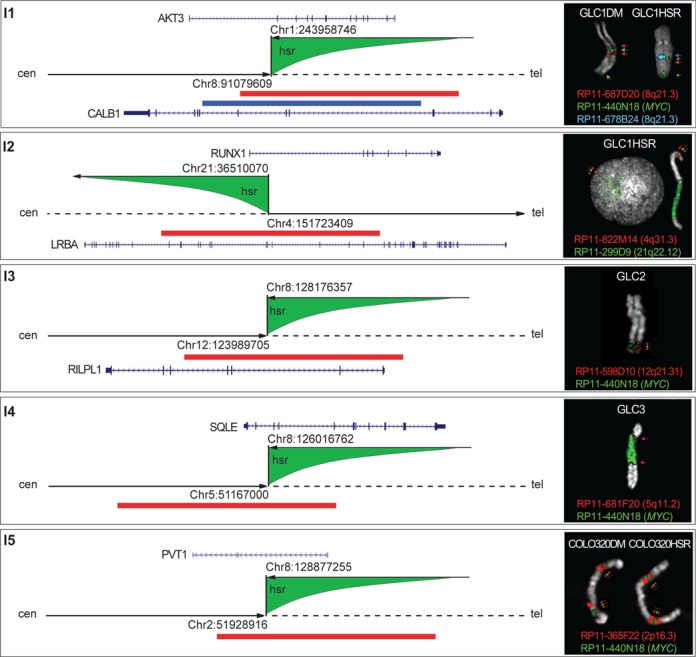
Figure 5.

Schematic representation of the hsr insertion sites mapped at the nucleotide level. Each corresponding SV is top-left reported. Arrowhead and dashed dark lines indicate the distal and proximal side of each insertion site along the hosting chromosome, respectively; green shapes represent the inserted hsr, and the upper arrows indicate sequence orientation. All insertion sites show sequences joined in opposite direction. The right boxes show FISH results with splitting probes (red and blue) surrounding the hsr (green) in each cell line. FISH probes are represented as colored bars along each inserted chromosome. Target genes are in blue; arrows indicate their transcriptional orientation.
