
Figure 4.
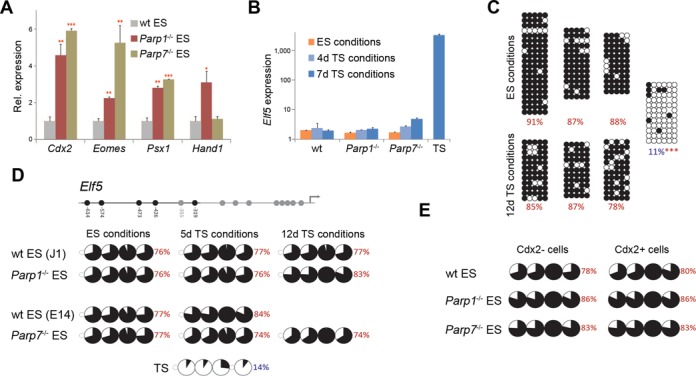
Acquisition of a limited set of TS cell features in the absence of Parp1 and Parp7. (A) RT-qPCR analysis of trophoblast marker gene expression in wildtype (wt), Parp1-/- and Parp7-/- ES cells cultured in TS cell medium for four days (*P < 0.05, **P < 0.01, ***P < 0.001). (B) RT-qPCR analysis of Elf5 expression in wildtype (wt; combined values of J1 and E14 ES cells), Parp1-/- and Parp7-/- ES cells cultured in ES cell conditions or in TS cell conditions for 4 or 7 days shows no induction of this trophoblast lineage gatekeeper gene. Expression levels in TS cells are provided for comparison. (C) Bisulphite sequencing analysis of the Elf5 gene promoter. Data were compared using the Chi-squared test (***P < 0.001). (D) Sequenom Epityper analysis of Elf5 promoter methylation. Pie charts represent average methylation levels at each CpG dinucleotide. The CpG units captured are indicated in the gene graph. (E) Sequenom Epityper analysis of Elf5 DNA methylation in wt, Parp1-/- and Parp7-/- ES cells cultured in ES cell conditions, stained for Cdx2 and FACS-sorted into Cdx2+ and Cdx2− cell populations.