Figure 5.

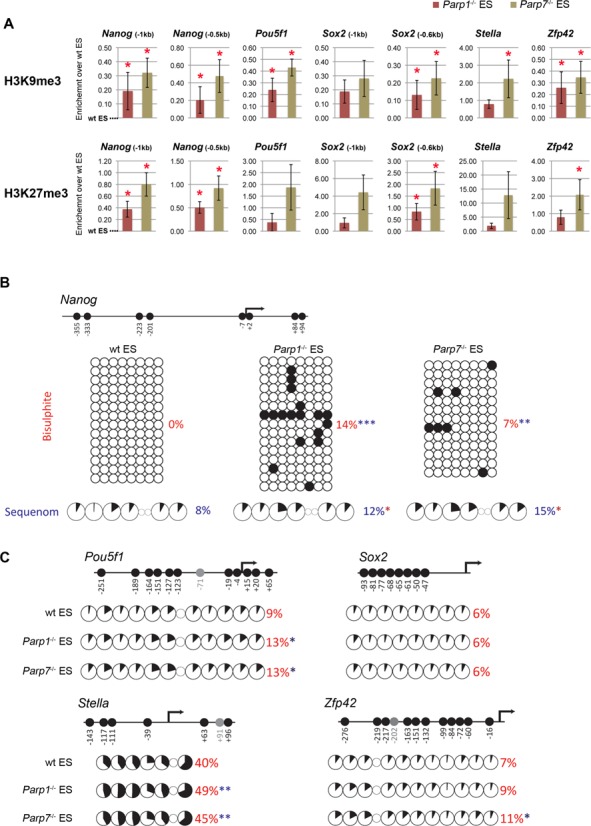
Accumulation of epigenetic repressive marks at pluripotency factor loci in Parp1-/- and Parp7-/- ES cells. (A) ChIP against histone modifications H3K9me3 and H3K27me3 in wildtype (wt), Parp1-/- and Parp7-/- ES cells cultured in ES cell conditions. Fold enrichment values were calculated from the ratio of bound to input DNA, and corresponding values from control IgG ChIPs were subtracted. Data are displayed with values in wt ES cells set to 0. (B) DNA methylation at the Nanog promoter by bisulphite sequencing and Sequenom Epityper analysis. The analysed region is depicted in the schematic of the locus. (C) Sequenom Epityper analysis of DNA methylation at the Pou5f1, Sox2, Stella and Zfp42 promoters. Graphic representations of the CpG distribution and those CpG dinucleotides analysed are indicated for each gene (*P < 0.05, **P < 0.01, ***P < 0.001).
